Why Chemical Wastewater Needs Ozone Oxidation
Refractory COD — the 200–500 mg/L fraction that survives conventional activated sludge and shows up in the secondary clarifier effluent — is the single most common reason chemical, pharmaceutical, and petrochemical plants explore ozone. Phenols, aniline and substituted aromatics, nitro compounds, sulfides, antibiotics, pesticides, and reactive azo dyes all carry electron-rich double bonds or heteroatoms that resist biological mineralization, generate color that fails visual discharge limits, and add toxicity that knocks out downstream biological polishing. Without a polishing step, the plant either pays excess sewer surcharges or bleeds COD into a receiving water body that no longer has assimilative capacity. An ozone-based AOP is one of the few commercially deployed options that can break those structures inside a closed tank at ambient temperature. Field data published in 2024 demonstrates the scale of what is achievable: 70% CODCr and 79.3% TOC removal on petrochemical wastewater at ozone 10 mg/L, persulfate 0.02 mol/L, Fe2+/Cu2+ 1:2, and 2 hours reaction time (Springer, 2024-03). That is a commercial result, not a bench-curve.
Ozone acts through two parallel mechanisms that engineers must understand before specifying a system. Direct molecular O3 attack is selective — it cleaves C=C bonds and oxidizes aromatic amines, phenols, and sulfide rapidly at pH 7–9, and it is the workhorse for color removal on dye streams. Indirect ·OH radical oxidation is non-selective and dominant above pH 9, where O3 decomposes to ·OH. Saturated aliphatics, pesticides, and many pharmaceuticals respond to ·OH but not to O3 alone, which is why pH control and catalyst choice move the removal number more than dose does. The common on-line primer on biological BOD removal guide for industrial wastewater upstream treatment is what determines how much of that COD ever reaches the ozone contactor.
Position ozone inside the AOP hierarchy correctly: Fenton is the cheapest CAPEX but generates 0.3–0.6 kg iron sludge per kg COD removed; UV/H2O2 is clean but capped by UV transmittance and lamp scaling; persulfate activation gives the highest COD/TOC numbers but brings oxidant cost and sulfate loading; wet air oxidation needs 200 °C and high pressure and is reserved for the most refractory streams. Ozone — alone, with H2O2, or with persulfate — sits in the middle: moderate CAPEX, no sludge, no thermal duty, but constrained by mass-transfer efficiency.
How an Ozone Oxidation System Works in a Chemical Plant
The unit operation is straightforward but the engineering choices inside it are not. Liquid oxygen from a vacuum-insulated tank, or on-site PSA/VPSA oxygen, feeds a corona-discharge ozone generator running at 5–15 g O3/Nm³ on dry air or 80–150 g/Nm³ on oxygen. The generator output enters a contactor through a venturi injector or a fine-bubble diffuser, disperses into the wastewater, and reacts in a baffled tank sized to the target hydraulic residence time. Off-gas leaving the contactor carries unreacted O3 plus excess O2; it goes to a thermal destruct unit (typically 350 °C, 1–2 s residence) or a catalytic destruct (MnO2/CuO on alumina) to drop residual O3 below 0.1 ppm before venting.
Three ozone generator technologies compete for the chemical plant duty. Corona discharge is the workhorse: 12–18 kWh/kg O3 on oxygen feed, capacities from 0.5 kg/h to 50+ kg/h per module, the right choice for anything above 10 m³/h influent. Electrolytic (PEM) cells run on electricity only — no LOX, no PSA — at 3–5 g/h per cell, and they cap out around 1–2 kg O3/day because cell stacks scale linearly. They fit a hospital pharmacy pilot, a small lab skid, or a polishing duty on a low-flow sidestream. UV lamp generators produce low-concentration O3 from air and are reserved for laboratory or polishing polishing. The PLC-controlled chemical dosing skid on the parallel product line illustrates the same on-site generation logic applied to ClO2 — operators control oxidant output from a panel rather than receiving a hazmat delivery.
Mass transfer is the bottleneck that determines whether the system pays back. A well-designed venturi-injection contactor with downstream pressurized pipe reactor achieves 60–85% single-pass O3 transfer; a poorly designed bubble-diffuser tank drops to 30–50%, doubling the apparent dose and the operating cost. The 2024 Springer microfiltration paper showed that reducing gas–liquid bubble size through membrane contactors lifts both transfer efficiency and degradation rate of methylene blue and ammonia-nitrogen. Operators who see transfer slip should look at diffuser fouling, influent TDS above 8,000 mg/L, or excessive oil carryover before assuming the generator is undersized. Contactor materials matter: SS316L with PVDF internals is the default for chemical service; 304SS fails in chloride + ozone because ozone accelerates pitting and chloride breaks the passive film; FRP with a vinyl ester liner is the correct choice for high-chloride petrochemical or brine-bearing streams.
Process Parameters That Actually Move the Needle
The table below consolidates the operating window an engineer can copy into a P&ID datasheet. The numbers come from the Springer 2024 O3-PMS study, the microfiltration-ozone paper (2024), and field practice on dye and pharma streams.
| Parameter | Operating Range | Design Target | Failure Symptom |
|---|---|---|---|
| pH | 7–9.5 | 7.5–8.5 for color/phenol; 9.5+ for ·OH-dominant pesticide duty | pH < 5.5 wastes O3; pH > 11 decomposes O3 before it contacts the target |
| O3 dose | 5–25 mg/L | 10 mg/L for coupled systems (Springer 2024) | Residual < 0.5 mg/L exiting contactor = underdosed |
| Residual O3 at contactor exit | 0.5–5 mg/L | 0.5–2 mg/L | > 5 mg/L = wasted oxidant and off-gas destruct load |
| HRT | 15–120 min | 30 min for dye decolorization; 60–120 min for COD on pesticide/pharma | < 15 min on a COD-bound stream means reactions are not finishing |
| Temperature | 10–45 °C | 15–35 °C | > 45 °C: O3 self-decomposes; < 10 °C: kinetics lag, dose must rise |
| H2O2:O3 molar ratio (peroxone) | 0.2–0.7 | 0.3–0.5 | > 0.7: residual H2O2 carries to RO and damages membranes |
| Fe2+ catalyst | 0.5–10 mg/L | 0.5–5 mg/L | Excess Fe precipitates downstream, fouls RO/MBR |
| Cu2+ catalyst | 0.5–5 mg/L | 1–2 mg/L with Fe2+ 1:2 | Cu discharge limit is tighter; check local consent |
| Heterogeneous catalyst | MnO2/Al2O3 or activated carbon bed | Fixed bed, 5–15 min EBCT | Bed fouling from oil/CaCO3 — backwash weekly |
| Influent oil/grease | < 50 mg/L | < 20 mg/L into contactor | Oil films block O3 transfer and consume oxidant |
Two ratios deserve a callout. The H2O2:O3 molar ratio of 0.3–0.5 is the most common non-catalytic upgrade path — at this point peroxone (O3/H2O2) generates enough ·OH to drop COD by 20–30 percentage points beyond ozone alone without adding a metal. The Fe2+:Cu2+ 1:2 ratio is the optimum from the 2024 O3-PMS work; Cu2+ drives amine and phenol selectivity while Fe2+ drives general ·OH production, and the pair outperforms either alone.
Ozone vs Other Advanced Oxidation Processes
Engineers choosing an AOP for a chemical stream rarely have unlimited budget or unlimited effluent tolerance. The four options that come up in practice are ozone alone, O3/H2O2 (peroxone), O3-persulfate with metal catalysis (O3-PMS), and Fenton. Each is a different trade between removal number, sludge, pH window, OPEX, and hazardous-chemical handling.
| AOP | COD Removal Range | Iron Sludge | pH Window | OPEX Driver | Hazardous Chemical Handling |
|---|---|---|---|---|---|
| O3 alone | 30–55% | None | 7–9 | Power (12–18 kWh/kg O3) + LOX | LOX; off-gas O3 |
| O3/H2O2 (peroxone) | 50–70% | None | 7–8.5 | H2O2 + power | 50% H2O2 bulk storage; compatible with most permits |
| O3-PMS with Fe2+/Cu2+ | 60–80% (70% COD, 79.3% TOC, Springer 2024) | Low (0.05–0.1 kg/kg COD) | 7–8.5 | Persulfate + metal + power | Sodium persulfate (oxidizer, Class 5.1); metal recovery needed for discharge |
| Fenton (Fe2+/H2O2) | 50–80% | 0.3–0.6 kg/kg COD removed | 2.5–3.5 | H2O2 + FeSO4 + sludge dewatering | Low-pH neutralization; sludge landfill; iron-tolerant downstream |
The decision rule is short. Choose Fenton when the downstream effluent has iron tolerance, CAPEX is the constraint, and sludge disposal is cheap. Choose O3/H2O2 when the load is variable, iron is restricted, and the plant already has peroxide receiving. Choose O3-PMS with catalysis when the target is the highest COD/TOC, the influent is high-salinity (typical petrochemical brine), and the plant is willing to handle a Class 5.1 oxidizer. The full economic logic of AOP selection is covered in the chemical cost optimization guide for wastewater plants — read it before signing the persulfate supply contract.
Integrating Ozone into a Full Chemical Wastewater Flowsheet
Ozone is a polishing step, not a primary treatment. The standard train for a 500–2,000 mg/L COD chemical stream is equalization → DAF or primary clarifier → biological (anoxic/aerobic or SBR) → ozone AOP → MBR or sand filter → optional RO for reuse. The biological stage targets readily biodegradable COD, the ozone stage targets the 200–400 mg/L recalcitrant fraction, and the MBR clarifies the AOP effluent to below 1 NTU before RO. Pre-engineered packages like the dissolved air flotation system upstream and the integrated MBR membrane bioreactor downstream bracket the ozone skid and are typically co-specified in the same P&ID package.
Three placement rules are non-negotiable. First, ozone sits after biology, not before — putting it first would oxidize readily biodegradable COD (wasted reagent) and lift BOD/COD back up, defeating the biological stage. Second, DAF precedes the ozone contactor when oil/grease exceeds 50 mg/L, because oil films block O3 transfer, foul diffusers, and consume oxidant at 5–8 mg O3 per mg oil. Third, MBR or an equivalent clarification follows ozone, not raw membrane filtration — the AOP effluent contains polymerized fragments and suspended catalyst fines that the MBR removes before they reach the RO feed. The downstream industrial RO system sees less biofouling precursor when MBR is in series, which is the reason MBR-AOP-RO is becoming the default for petrochemical reuse duty.
Costs, Power Use, and Operator Headcount in 2026
CAPEX for a packaged ozone skid sized to chemical-plant duty — generator, contactor, LOX or PSA supply, off-gas destruct, PLC, and structural skid — runs USD 180,000–650,000 for 10–50 m³/h influent (HydropureWater commercial quotations, 2026). Below 10 m³/h the per-m³ CAPEX jumps 30–60% because skid engineering dominates over equipment cost; above 50 m³/h the curve flattens as modular generator skids are paralleled. Add 25–40% for installation, instrumentation, and civil works.
OPEX lands at USD 0.35–0.90 per cubic meter of treated flow, dominated by two line items. Power is 12–18 kWh per kg O3 produced on a corona discharge unit, and at industrial power of USD 0.08–0.12/kWh in 2026 that is roughly USD 0.20–0.45 per m³ for a 10 mg/L dose. Liquid oxygen is USD 0.10–0.20/kg O3; a 10 m³/h plant dosing 10 mg/L O3 burns about 0.8–1.0 kg O3/h, so LOX is on the order of USD 2,000–4,800 per month. H2O2 for peroxone adds USD 0.05–0.15/m³. PEM/electrolytic units avoid LOX and run on electricity only at 3–5 g/h per cell, but they cap around 1–2 kg O3/day and only fit hospital, lab, or small pilot duty. Operator headcount is 0.5 FTE per 24/7 plant for routine ORP, residual O3, and generator diagnostics; no licensed chemical handling is required unless H2O2 or persulfate is on site.
Pilot Testing, Safety, and Common Failure Modes
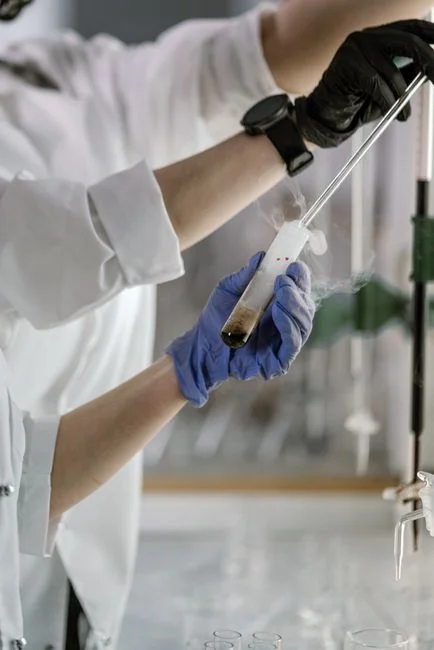
A 2–4 week pilot on a 1–5 m³/h slipstream is the standard gate before CAPEX release. Measure COD, TOC, color, BOD/COD ratio, and residual O3 at the contactor exit; the design dose is the lowest that holds residual O3 in the 0.5–2 mg/L window at the chosen HRT. Run at three pH setpoints (7, 8.5, 9.5) and three doses to map the response surface — the Springer 2024 optimum is a starting point, not a guarantee on a different influent. Always run an oil/grease and TDS screen before the pilot: oil above 50 mg/L or TDS above 8,000 mg/L will distort the result and force a different contactor design.
Safety is dominated by three hazards. Residual O3 above 0.1 ppm in vented off-gas is a respiratory irritant — the thermal or catalytic destruct is mandatory and must be interlocked to generator trip. Liquid oxygen lines need LEL monitoring and oil-free construction, identical to the rules for PSA oxygen supply. All wetted parts in chloride + ozone service must be SS316L with PVDF internals or FRP with vinyl-ester liner; 304SS pits in months, not years, and the failure mode is a weeping contactor full of O3-saturated wastewater.
Failure modes to instrument against: dielectric scaling in corona generators from oil carryover (install a coalescing filter on the feed air or oxygen); diffuser fouling from CaCO3 or Fe(OH)3 (acid wash quarterly, or switch to venturi injection); and loss of transfer efficiency when influent TDS climbs past 8,000 mg/L (move to membrane-contactor geometry per the 2024 Springer microfiltration paper). Plant EHS will ask all three questions in the design review — have the answers ready.
Frequently Asked Questions
What COD removal can ozone achieve on chemical wastewater? Ozone alone typically delivers 30–55% COD on chemical streams; O3/H2O2 reaches 50–70%; O3-PMS with Fe2+/Cu2+ catalysis hits 70% COD and 79.3% TOC at the Springer 2024 optimum (O3 10 mg/L, persulfate 0.02 mol/L, 2 h, petrochemical influent).
Is ozone or Fenton cheaper for chemical wastewater? Fenton wins on OPEX when the downstream has iron tolerance, sludge disposal is cheap, and CAPEX is the constraint. Ozone wins when iron discharge is restricted, RO is downstream, or the stream is high-salinity brine where Fenton's pH 2.5–3.5 envelope is uneconomic.
What ozone dose for dye wastewater? 8–15 mg/L O3 with 30 min HRT decolorizes more than 95% of reactive and disperse dyes; the AOP step is rarely needed for color, only for COD breakthrough on dye baths with high organic load.
Does ozone replace biological treatment? No. Ozone polishes the recalcitrant fraction that biology cannot mineralize; putting biology first protects ozone dose and prevents the BOD rebound that occurs when ozone cracks larger molecules into smaller biodegradable fragments.
How much power does an ozone generator use? 12–18 kWh per kg of O3 produced on a corona-discharge unit fed oxygen; 18–28 kWh/kg on air feed; 6–9 kWh/kg on a PEM/electrolytic cell, which is offset by far lower output capacity.
Related Equipment
- PLC-controlled chemical dosing skid — specifications, capacity range, and technical data