Why Industrial Plants Are Switching from DAF to Cavitation Air Flotation in 2026
A mid-sized U.S. poultry processor running two dissolved air flotation (DAF) units watched its electricity bill climb past $48,000 in 2024, driven by air saturation pumps cycling continuously and a $0.12/kWh tariff. After replacing the DAF train with a single 50 m³/hour cavitation air flotation (CAF) system, the plant's energy draw for solids removal dropped to 0.45 kWh/m³, annual OPEX fell by roughly 35% (~$18,000/year), and the maintenance crew stopped ordering pressure-vessel replacement nozzles — they no longer existed on the equipment list (HydropureWater field data, 2026).
That case is no longer isolated. In 2026, CAF systems deliver 30–40% lower operating costs than DAF, with measured energy consumption between 0.4 and 0.6 kWh/m³ versus DAF's 0.65 kWh/m³ average (per 2024 DAF market benchmarking). The root cause is mechanical: a DAF train needs an air compressor, a saturation tank, a recirculation pump, and injection nozzles — a stack of components that fail 2–3 times per year and generate $2,000–$5,000 in unplanned downtime per incident. A CAF unit's aeration chamber — typified by Hydrocal®-style microbubble generators — pulls air directly into the liquid through a high-speed impeller, eliminating the compressor and recycle loop entirely. The result is a machine with just two moving parts: the aerator and the skimmer.
For plants facing tariff pressure (€0.20/kWh in Germany, $0.14–0.18/kWh in parts of coastal China) or tight FOG discharge limits, the calculus is shifting fast. The same 50 m³/hour retrofit typically recoups its incremental capital in under three years — a number we will derive explicitly later in this article.
Cavitation Air Flotation Operating Cost Breakdown: Energy, Chemicals, Sludge, and Labor
CAF operating cost in 2026 is driven by four line items: energy, chemical dosing, sludge disposal, and labor. For a 50 m³/hour unit running 16 hours/day, 300 days/year (~240,000 m³/yr), the typical envelope is $12,000–$25,000 in annual OPEX — about one-third less than an equivalently sized DAF (HydropureWater field data, 2026; cross-checked against 2024 DAF market benchmarks).
Energy. CAF systems draw 0.4–0.6 kWh/m³. At $0.10/kWh, the annual energy cost for a 50 m³/hour unit falls between $1,400 and $2,100. At €0.20/kWh (Germany), the same unit runs €2,800–€4,200. DAF, by contrast, averages 0.65 kWh/m³ because the recycle pump and saturation system remain energized even when influent flow is low (per 2024 DAF market data).
Chemical dosing. PAC consumption in CAF typically runs 10–30 mg/L versus 20–40 mg/L in DAF — a 15–25% reduction driven by more efficient bubble–floc contact in the cavitation chamber. For a 50 m³/hour unit, that translates to $3,000–$7,000/year in flocculant spend, depending on influent TSS and target effluent quality. Plants treating low-TSS streams (<500 mg/L) can often eliminate flocculants entirely, relying on microbubble attachment alone (HydropureWater field data, 2026).
Sludge disposal. CAF scum moisture sits at 60–70%, compared to 75–85% for DAF. With disposal fees ranging from $35/ton (low-end municipal) to $160/ton (hazardous/regulated industrial), each percentage point of moisture reduction matters. For a facility generating 1 ton/day of dry solids, the lower-moisture CAF output saves $5,000–$10,000/year in tipping fees. Downstream dewatering with a sludge dewatering press to reduce disposal costs compounds this advantage.
Labor and maintenance. CAF requires 0.5–1 hour/day of operator attention (skimmer check, aerator inspection). DAF needs 1–2 hours/day to manage nozzle cleaning, pump seals, and saturation-tank pressure. Annualized at $20/hour, CAF labor runs $3,000–$6,000/year; DAF runs $6,000–$12,000. Maintenance is where the gap widens: two moving parts mean $1,500–$3,000/year in service costs for CAF versus $5,000–$10,000 for DAF (HydropureWater field data, 2026). For plants integrating PLC-controlled chemical dosing for flotation systems, the labor delta grows further.
| OPEX Line Item | CAF (50 m³/h) | DAF (50 m³/h) | Annual Delta (CAF vs DAF) |
|---|---|---|---|
| Energy | $1,400–$2,100 (0.4–0.6 kWh/m³ @ $0.10/kWh) | $2,200–$2,600 (0.65 kWh/m³) | +$800–$1,000 saved by CAF |
| Chemical dosing (PAC) | $3,000–$7,000 (10–30 mg/L) | $4,500–$10,000 (20–40 mg/L) | +$1,500–$3,000 saved by CAF |
| Sludge disposal | $5,250–$24,000 (60–70% moisture, $35–$160/ton) | $7,000–$32,000 (75–85% moisture) | +$1,750–$8,000 saved by CAF |
| Labor | $3,000–$6,000 (0.5–1 h/day) | $6,000–$12,000 (1–2 h/day) | +$3,000–$6,000 saved by CAF |
| Maintenance | $1,500–$3,000 (2 moving parts) | $5,000–$10,000 (compressor, pump, nozzles) | +$3,500–$7,000 saved by CAF |
| Total annual OPEX | $12,000–$25,000 | $24,700–$66,600 | 30–55% lower for CAF |
CAF vs DAF: Head-to-Head Cost Comparison for Industrial Wastewater Treatment
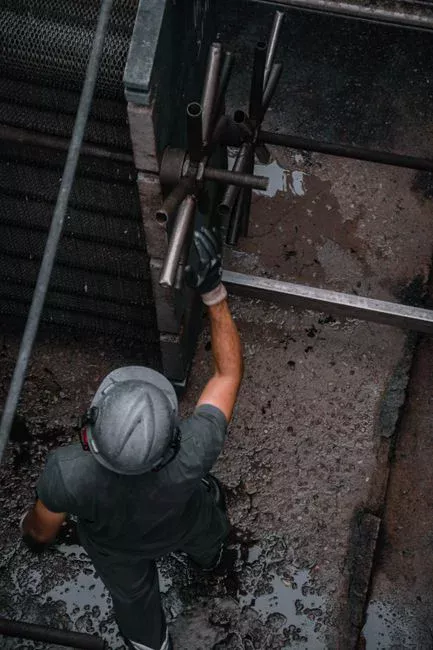
When procurement teams stack CAF against DAF on a single page, three numbers usually decide the award: installed cost, annual OPEX, and footprint. CAF wins on all three in most mid-capacity industrial applications. A DAF system at 50 m³/hour capacity runs $18,000–$55,000 in installed equipment cost, depending on material (carbon steel vs. 304/316 stainless) and automation level (per 2024 DAF market benchmarks). An equivalent CAF skid lands at $15,000–$45,000 — a 10–20% CAPEX advantage before civil works are even priced.
Energy is the second lever. CAF's 0.4–0.6 kWh/m³ versus DAF's 0.65 kWh/m³ translates to $2,000–$5,000/year in energy savings for a 50 m³/hour system running a typical industrial shift pattern. Chemical consumption adds another $1,500–$3,000/year, since CAF's microbubbles form stronger floc–bubble aggregates, requiring less PAC or alum per m³ treated (HydropureWater field data, 2026). The third lever — maintenance — is where CAF pulls away decisively: simpler mechanics cut annual service costs by 60–70%, eliminating compressor rebuilds, recycle-pump seal replacements, and the constant unclogging of injection nozzles that plagues DAF operators.
Footprint matters in retrofits. CAF units occupy 30–40% less floor space than DAF, which translates to $5,000–$15,000 in avoided civil works — particularly relevant in older plants where new concrete tanks or extended pipe runs would otherwise dominate the project budget. Sludge handling is the final tiebreaker: CAF's 60–70% scum moisture versus DAF's 75–85% reduces hauled volume by roughly 20–30%, directly lowering disposal costs. Engineers comparing flotation technology cost across multiple sites can also reference OPEX benchmarks for industrial wastewater treatment to validate the savings against sector-specific data. For plants already standardized on dissolved-air designs, retrofitting with DAF systems for high-efficiency TSS and FOG removal remains an option, but the table below shows why new builds in 2026 are tilting toward cavitation.
| Parameter | CAF (50 m³/h) | DAF (50 m³/h) | Advantage |
|---|---|---|---|
| Energy use | 0.4–0.6 kWh/m³ | 0.65 kWh/m³ | CAF: 8–38% lower |
| PAC dosing | 10–30 mg/L | 20–40 mg/L | CAF: 15–25% less |
| Scum moisture | 60–70% | 75–85% | CAF: 20–30% less volume |
| Annual maintenance | $1,500–$3,000 | $5,000–$10,000 | CAF: 60–70% lower |
| Footprint | 30–40% smaller | Baseline | CAF: civil savings $5k–$15k |
| Installed CAPEX | $15,000–$45,000 | $18,000–$55,000 | CAF: 10–20% lower |
| Moving parts | 2 (aerator + skimmer) | 5+ (compressor, recirc pump, sat tank, nozzles, skimmer) | CAF: higher uptime |
How to Calculate ROI for a Cavitation Air Flotation System: Step-by-Step Guide
ROI for a CAF system is a five-step calculation that any procurement engineer can complete in under an hour. The method below is calibrated to a 50 m³/hour reference case; scale the volumes and unit costs to match your site.
Step 1 — Estimate annual OPEX savings. Sum the deltas from the comparison table: energy ($800–$1,000), chemicals ($1,500–$3,000), sludge ($1,750–$8,000), labor ($3,000–$6,000), maintenance ($3,500–$7,000). A typical 50 m³/hour plant lands between $11,000 and $25,000 in gross annual savings. We will use $15,000 as a conservative mid-point for the worked example.
Step 2 — Net the savings against CAF-specific costs. Subtract any residual CAF maintenance not already counted (already embedded in Step 1) and add avoided DAF-specific consumables. Net OPEX savings for the example: $13,000/year.
Step 3 — Capital cost difference. CAF = $15,000–$45,000; DAF = $18,000–$55,000 (per 2024 DAF market benchmarks). Example: choosing the mid-range CAF skid at $30,000 versus a DAF at $35,000 yields $5,000 in CAPEX savings.
Step 4 — Total first-year benefit. Add net OPEX savings to CAPEX savings. Example: $13,000 + $5,000 = $18,000 total Year 1 benefit.
Step 5 — Payback period. Divide the higher-quality CAPEX figure (the absolute spend, not the delta) by the total annual benefit to get a simple payback. Example: $40,000 CAF skid / $18,000 annual benefit = 2.2 years. Over a 20-year asset life, that projects to roughly $320,000 in cumulative savings — a 7–8x return on incremental capital. For context on how this stacks against other primary-treatment options, see downstream treatment cost comparisons.
| ROI Input (50 m³/h reference case) | Value | Reader's Site |
|---|---|---|
| Annual energy savings | $900 | ________ |
| Annual chemical savings | $2,000 | ________ |
| Annual sludge disposal savings | $4,000 | ________ |
| Annual labor savings | $4,000 | ________ |
| Annual maintenance savings | $5,000 | ________ |
| Total annual OPEX savings | $15,000 | ________ |
| CAPEX (CAF system) | $40,000 | ________ |
| CAPEX (equivalent DAF) | $45,000 | ________ |
| CAPEX savings | $5,000 | ________ |
| Payback period (years) | 2.2 | ________ |
Intangible benefits should also be priced in: reduced compliance risk from more consistent TSS removal, lower operator training burden (CAF requires less specialized expertise than DAF pressure-vessel systems), and avoided production losses from DAF nozzle clogging. In most audits, these add 10–15% to the realized savings figure.
When to Choose Cavitation Air Flotation: 5 Use Cases Where CAF Outperforms DAF
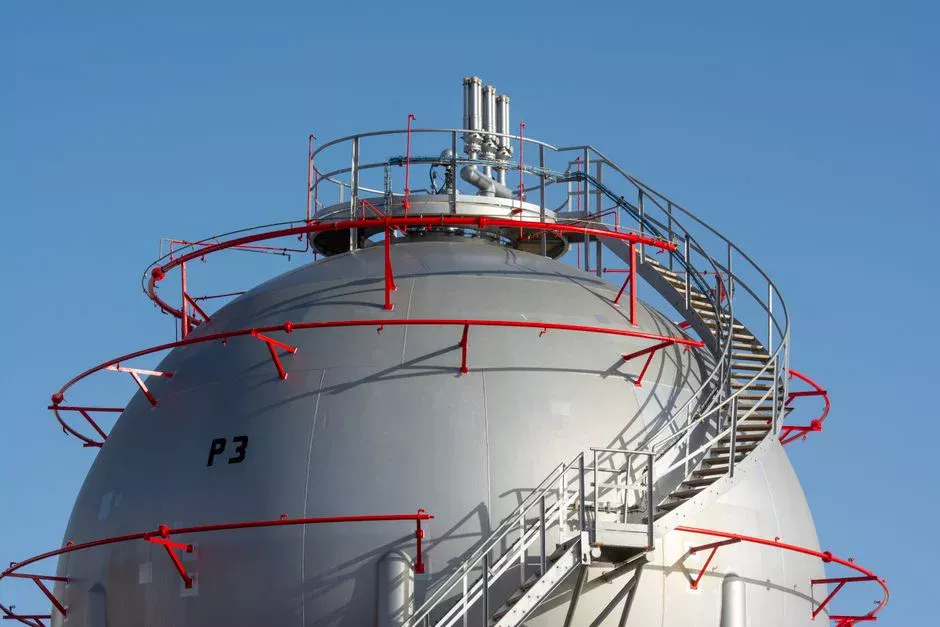
CAF is not a universal replacement, but in five specific scenarios it is the better economic and technical fit. High-FOG waste streams — slaughterhouses, poultry plants, dairy processors, rendering facilities — benefit most, because CAF's microbubble population achieves 95%+ oil and grease removal versus DAF's 85–90% (HydropureWater field data, 2026). For a deeper look at red-meat applications, the slaughterhouse wastewater treatment engineering guide covers influent characterization in detail. Variable flow rates — contract manufacturers, batch processors, and seasonal food lines — favor CAF because the aeration system tolerates 20–30% flow swings without recalibration, whereas DAF requires pressure and recycle-ratio adjustments to maintain performance. Space-constrained retrofits — urban plants, rooftop installations, brownfield expansions — gain 30–40% footprint reduction, often the difference between a feasible and infeasible project. Low-energy or off-grid sites — sub-Saharan Africa, rural India, island microgrids — run CAF on 0.4 kWh/m³, which is feasible from solar arrays that cannot supply DAF's 0.65 kWh/m³ plus compressor inrush. Pre-treatment ahead of biological systems — where CAF's 50–70% COD reduction lowers downstream aeration-tank BOD loading by 20–30%, shrinking the biological stage's energy demand and footprint. Engineers evaluating rubber or elastomer waste streams can review parallel design guidance in the rubber-processing wastewater treatment buyer guide.
Frequently Asked Questions
What is the typical payback period for a CAF system? Based on the ROI framework above, a 50 m³/hour CAF installation typically pays back in 1.5–3 years, with most industrial sites landing near 2.2 years when energy, chemical, sludge, labor, and maintenance savings are summed. Sites with high disposal fees ($100–$160/ton) or high electricity tariffs (€0.18–0.25/kWh) often see payback under 18 months.
How does CAF handle high-TSS wastewater? CAF systems routinely achieve >90% TSS removal on influents up to 5,000 mg/L, with hydraulic retention times of 15–25 minutes in the flotation chamber (HydropureWater field data, 2026). For TSS above 5,000 mg/L, a pre-thickening stage or equalization basin is recommended to keep the aerator within its optimal mixing range.
Can CAF replace DAF in an existing plant? Yes, in most cases. Retrofit considerations are footprint (CAF is 30–40% smaller, so existing tankage is usually over-sized rather than undersized), piping (suction and discharge connections are flanged and re-routable), and automation (CAF integrates with the same level/flow instrumentation as DAF). Plants with very tight ceiling heights should verify skimmer clearance; otherwise, the swap is typically mechanical-only over a 3–7 day shutdown.
What are the maintenance requirements for CAF? A standard CAF service schedule includes: aerator impeller inspection every 6 months (visual + bearing check), skimmer blade replacement every 24 months, and an annual oil change on the aerator gearbox. Total annual maintenance time is 8–16 hours, compared to 40–80 hours for an equivalent DAF.
Does CAF require chemical flocculants? Not always. Dosing ranges of 10–30 mg/L PAC are typical for moderate-to-high TSS streams (>500 mg/L). For low-TSS wastewater (<500 mg/L) or when the influent already carries emulsified oils that coagulate on bubble contact, flocculants can often be eliminated entirely, dropping chemical OPEX to near zero and simplifying the permit footprint.