Why Slaughterhouse Wastewater Is a Unique Treatment Challenge
Slaughterhouse effluent has been classified by the US EPA among the most harmful industrial discharges to the environment, a designation that still anchors 2026 design practice (per the 2001 Alexandria study and ScienceDirect 2024 review). Five characteristics justify that classification: organic strength measured as BOD₅ 1,000–3,500 mg/L, suspended solids 800–2,000 mg/L, fats oils and grease (FOG) 200–1,500 mg/L, total nitrogen 100–300 mg/L with total phosphorus 10–40 mg/L, and pathogen loads of 10⁶–10⁸ MPN/100 mL fecal coliforms. Temperature sits between 25–35 °C, which accelerates biological activity but rules out cold-climate lagoon-only designs.
Operational variability is the second design driver. Batch slaughtering creates peak-to-average flow ratios of 3–5× within a single shift as cattle or pig lines start up, eviscerate, and clean down. Seasonal throughput swings of ±30% are normal in regions with religious festivals or holiday production peaks. Equipment sized on average flow will fail hydraulically within months.
The 2026 regulatory framework treats this effluent as a high-risk stream on three continents. In the United States, 40 CFR Part 432 sets subcategory-specific limits for meat products, poultry products, and rendering. In the European Union, the Industrial Emissions Directive 2010/75/EU applies BAT-AEL ranges issued in the 2017 Slaughterhouses and Animal By-products BREF, with 2026 BAT conclusions under review that tighten ammonia-N for new plants. In China, GB 13457-92 governs centralized discharge, while GB 30485-2013 applies the livestock- and poultry-specific parameters for farms and standalone slaughter lines. The rest of this article gives you the influent data, unit process performance, and CAPEX/OPEX numbers to design against these limits.
Slaughterhouse Wastewater Characteristics and Typical Influent Parameters
The table below consolidates typical influent values across cattle, pig, and poultry slaughter lines, drawn from the 2011 Pakistan field study and the 2001 Alexandria baseline. Use it as a design-basis reference; site-specific characterization is still required for any plant above 100 m³/d.
| Parameter | Cattle slaughter | Pig slaughter | Poultry slaughter | Units |
|---|---|---|---|---|
| Flow per animal processed | 1.0–2.5 | 0.5–1.5 | 0.3–1.0 | m³/animal |
| pH | 6.5–8.5 | 6.5–8.0 | 6.5–8.0 | — |
| BOD₅ | 1,200–2,500 | 1,500–3,500 | 1,000–2,200 | mg/L |
| COD | 2,500–5,000 | 3,000–6,000 | 2,000–4,500 | mg/L |
| TSS | 1,200–2,000 | 800–1,500 | 600–1,200 | mg/L |
| FOG | 200–800 | 400–1,000 | 500–1,500 | mg/L |
| Total nitrogen | 100–250 | 150–300 | 150–300 | mg/L |
| Total phosphorus | 10–30 | 15–40 | 10–30 | mg/L |
| Temperature | 25–32 | 25–33 | 25–35 | °C |
| Fecal coliforms | 10⁶–10⁷ | 10⁶–10⁷ | 10⁶–10⁸ | MPN/100 mL |
Poultry lines consistently carry the highest FOG and ammonia load because of feather and offal content. Pig lines record the highest BOD, driven by blood and gut residues. Cattle lines show the highest TSS and blood-protein load, which is why blood recovery at the kill floor is the single most effective in-plant pollution-control measure: capturing blood at source cuts influent BOD by 25–40% before any wastewater equipment is touched. Where blood and paunch content are poorly managed, downstream biology suffers shock loads that no equalization basin can fully buffer.
The Five-Stage Treatment Train: From Screening to Disinfection
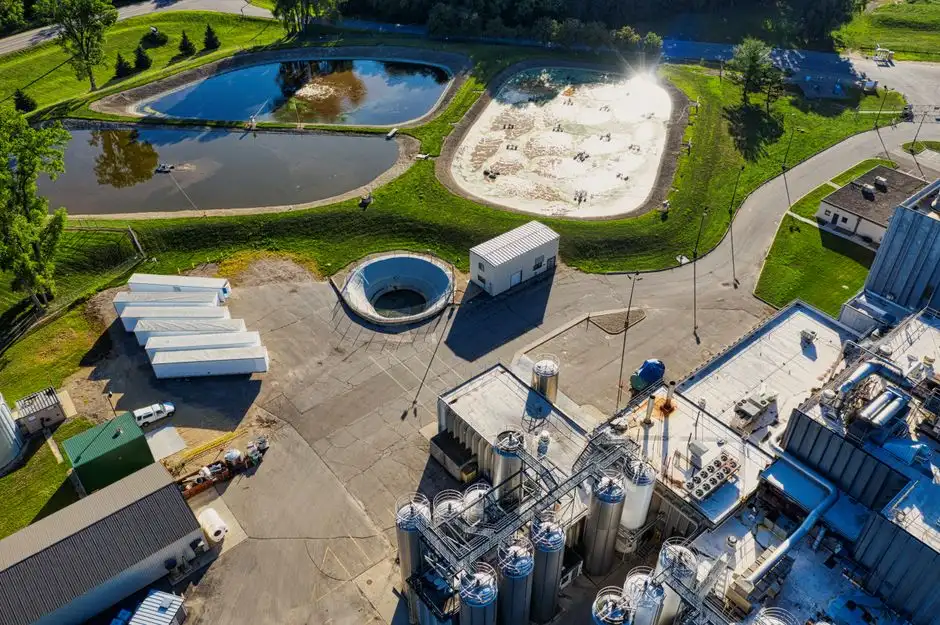
The canonical 2026 train for abattoir wastewater runs in six unit operations. Each has a defined role, sizing range, and documented removal efficiency, summarized in the table that follows.
Stage 1 — Pre-treatment uses a rotary bar screen for headworks at 3–6 mm aperture to recover solids, followed by a grit chamber to settle bone fragments and paunch. Removal is modest at 10–20% TSS and 5–10% BOD, but protects every downstream piece of equipment.
Stage 2 — DAF is the workhorse. A DAF system for FOG and TSS removal operating at 4–6 m³/h recycle ratio, dosed with polyaluminum chloride 50–150 mg/L and anionic polymer 1–5 mg/L, with an air-to-solids ratio of 0.02–0.06, removes 60–90% FOG, 50–80% TSS, and 30–50% BOD. DAF performance dominates the rest of the train — if the float is cloudy, every downstream stage pays for it.
Stage 3 — Equalization uses a 12–24 h HRT basin with coarse-bubble aeration to dampen the 3–5× peak flow swings and prevent septicity. Surface mixers or submersible aerators sized at 5–8 W/m³ are typical.
Stage 4 — Anaerobic treatment typically takes the form of a UASB reactor or a hydrolytic acidification tank. Design upflow velocity is 0.5–1.0 m/h, HRT 12–36 h, and organic loading rate 2–10 kg COD/m³·d. Documented COD removal is 60–80%, with biogas yield of 0.3–0.4 m³ CH₄ per kg COD removed. The 2011 Pakistan study confirms hydrolytic acidification followed by SBR as a working combination at industrial scale.
Stage 5 — Aerobic polishing is normally an MBR system for aerobic polishing running at MLSS 8,000–12,000 mg/L with a PVDF submerged membrane flux of 12–20 L/m²·h, or an SBR at 3,000–5,000 mg/L MLSS on a 6-hour cycle. Combined train COD removal exceeds 95%.
Stage 6 — Disinfection with a ClO₂ disinfection system at 2–5 mg/L residual for 30 minutes contact time achieves >99.9% coliform kill. Iron-filing micro-electrolysis followed by co-precipitation is an emerging polishing option for residual color and refractory COD in Chinese installations, but it remains a tertiary add-on rather than a mainstream stage.
Sludge handling closes the loop. Combined primary and biological sludge is thickened and dewatered on a plate-and-frame filter press to 22–28% dry solids, with yield 0.3–0.6 kg DS per kg COD removed.
| Stage | Equipment | Key sizing parameter | Removal efficiency |
|---|---|---|---|
| 1. Pre-treatment | Bar screen + grit chamber | 3–6 mm aperture | 10–20% TSS, 5–10% BOD |
| 2. DAF | Dissolved air flotation | A/S 0.02–0.06; recycle 4–6 m³/h | 60–90% FOG, 50–80% TSS |
| 3. Equalization | Aerated buffer basin | HRT 12–24 h | Flow smoothing only |
| 4. Anaerobic | UASB / hydrolytic tank | OLR 2–10 kg COD/m³·d | 60–80% COD |
| 5. Aerobic | MBR or SBR | Flux 12–20 L/m²·h (MBR) | 90–95% COD (stage) |
| 6. Disinfection | ClO₂ generator | 2–5 mg/L, 30 min CT | >99.9% coliform kill |
Comparing Process Train Options for Slaughterhouse Effluent
Three configurations dominate 2026 procurement shortlists for meat processing effluent between 50 and 500 m³/d. Each pairs with the same DAF pre-treatment, but differs in downstream biology, footprint, and budget.
Option A — Conventional anaerobic pond plus activated sludge — is the lowest CAPEX at USD 150–300 per m³/d capacity, but it needs a large footprint and works best in warm climates with available land. Effluent COD is typically 150–250 mg/L, which clears municipal-sewer discharge but not direct surface-water release.
Option B — UASB plus MBR — is the highest-performance option. Effluent COD drops below 100 mg/L, suitable for water reuse. CAPEX runs USD 400–700 per m³/d and OPEX USD 0.10–0.25 per m³. Footprint is roughly 60% smaller than Option A. This is the default for plants discharging to sensitive waters or pursuing a reuse permit.
Option C — SBR plus chemical precipitation, typically with hydrolytic acidification upstream — delivers COD 100–150 mg/L at moderate CAPEX of USD 300–500 per m³/d and OPEX of USD 0.15–0.30 per m³. It tolerates variable loads and is the workhorse configuration in China and Southeast Asia for 50–200 m³/d plants. The 2011 Pakistan study documents this exact combination at full scale.
| Option | Configuration | Effluent COD | CAPEX (USD/m³/d) | OPEX (USD/m³) | Footprint |
|---|---|---|---|---|---|
| A | Anaerobic pond + activated sludge | 150–250 mg/L | 150–300 | 0.08–0.18 | Large |
| B | UASB + MBR | <100 mg/L | 400–700 | 0.10–0.25 | Small |
| C | Hydrolytic acidification + SBR + chem. ppt. | 100–150 mg/L | 300–500 | 0.15–0.30 | Medium |
Decision rule: discharge to municipal sewer → Option A or C; discharge to surface water or reuse → Option B; remote site with intermittent operation → Option C with extended sludge holding. Across all three, DAF selection and performance is the single most cost-effective decision — a poorly set DAF will sabotage the best biology downstream. The technical foundations for the upstream suspended-solids step are covered in our suspended solids removal engineering guide.
2026 Discharge Compliance and Reuse Standards
Three regulatory regimes govern most 2026 slaughterhouse projects. Engineers writing a specification should hit the tightest of the three unless the discharge route is fixed.
| Parameter | US EPA 40 CFR 432 | EU BAT-AEL 2017 (2026 review) | China GB 30485-2013 / GB 13457-92 |
|---|---|---|---|
| BOD₅ | 28 mg/L (mo. avg) / 47 (daily max) | 15–40 mg/L | 30 mg/L |
| COD | — | 50–150 mg/L | 100 mg/L |
| TSS | 30 mg/L | 15–70 mg/L | 70 mg/L |
| FOG | 13 mg/L | — | — |
| Total nitrogen | 87 mg/L | 15–50 mg/L (NH₃-N <10 mg/L new plants, 2026) | NH₃-N 15 mg/L |
| Total phosphorus | — | 2–5 mg/L | 0.5 mg/L |
| Fecal coliform | 200 MPN/100 mL | — | 10,000 MPN/L |
Reuse targets are tighter. If the operator is sending effluent to landscape irrigation or boiler feed, expect COD <50 mg/L, TDS <500 mg/L, and ClO₂ residual <0.1 mg/L — a downstream RO polishing stage is normally required to meet that envelope. The 2026 EU BAT review proposes an ammonia-N ceiling below 10 mg/L for new plants, which already pushes designs toward MBR with dedicated nitrification rather than conventional activated sludge.
2026 compliance snapshot: the most demanding envelope for greenfield slaughterhouse projects is China GB 30485-2013 (TP 0.5 mg/L) combined with EU BAT-AEL NH₃-N <10 mg/L. Hitting both typically requires MBR polishing plus chemical phosphorus precipitation.
CAPEX, OPEX, and Energy Benchmarks for a 200 m³/d Plant
For a 200 m³/d UASB + MBR plant in 2026, total installed CAPEX sits at USD 350,000–500,000 covering skid, civil works, and erection. Costs run higher in EU and North America, lower in South and Southeast Asia. Operating cost per cubic meter treated breaks down as follows.
| OPEX line item | USD per m³ treated | Notes |
|---|---|---|
| Electrical energy (aeration-dominated) | 0.06–0.12 | 50–60% of total energy |
| Chemicals (PAC, polymer, NaOH, ClO₂) | 0.04–0.08 | — |
| Sludge haulage | 0.03–0.07 | — |
| Labor, membranes, maintenance | 0.04–0.10 | Membrane replacement every 5–7 yr |
| Total OPEX | 0.18–0.40 | — |
Total energy consumption is 1.2–2.0 kWh per m³. Biogas from the UASB stage can offset 15–30% of plant electricity if a CHP unit is fitted. A 200 m³/d plant reusing 70% of its effluent saves roughly USD 50,000–80,000 per year in fresh-water purchase and discharge fees, which gives a 4–6 year payback in water-stressed regions. For the cost levers, the aeration energy cost optimization guide walks through the blower and DO-control tuning that drives most of the savings.
Frequently Asked Questions
What BOD and COD are normal for slaughterhouse wastewater?
BOD₅ of 1,000–3,500 mg/L and COD of 2,000–6,000 mg/L are typical across cattle, pig, and poultry lines, with pig slaughter at the high end (per 2011 Pakistan field data). Anything below 800 mg/L BOD usually indicates effective in-plant blood recovery.
Which DAF sizing rule should I use for a 200 m³/d plant?
Size the DAF for hydraulic loading of 4–6 m³/m²·h with a recycle ratio of 20–30% and an air-to-solids ratio of 0.02–0.06. Dose PAC at 50–150 mg/L and anionic polymer at 1–5 mg/L; expect 60–90% FOG removal at these settings.
Why is UASB preferred over a conventional septic tank for slaughterhouse effluent?
A UASB operates at upflow velocity 0.5–1.0 m/h with OLR 2–10 kg COD/m³·d and achieves 60–80% COD removal plus usable biogas (0.3–0.4 m³ CH₄/kg COD). A septic tank delivers 30–50% COD removal, no biogas capture, and a much larger footprint.
When should I choose MBR over SBR for the aerobic stage?
Choose MBR when the discharge limit is COD <100 mg/L, when footprint is constrained, or when reuse is planned. Choose SBR when the plant is 50–200 m³/d with moderate effluent targets (COD 100–150 mg/L) and CAPEX budget is tighter.
How do I calculate sludge production for a 200 m³/d plant?
Combined primary and biological sludge yield is 0.3–0.6 kg dry solids per kg COD removed. For an influent of 3,000 mg/L COD at 95% removal on 200 m³/d, expect 170–340 kg DS/d before dewatering, dropping to a 22–28% dry-solids cake after the filter press.