Where Nanofiltration Fits in the Membrane Spectrum
Nanofiltration occupies the pressure-driven membrane window defined by a molecular weight cut-off (MWCO) of 200–1000 Da and an effective pore size of roughly 0.5–2 nm — tighter than ultrafiltration, looser than reverse osmosis. Rejection reflects that geometry and the membrane's fixed negative charge: divalent ions such as Ca²⁺, Mg²⁺ and SO₄²⁻ are rejected at 90–99% through a combination of size exclusion and Donnan exclusion, while monovalent ions (Na⁺, Cl⁻) pass at 20–80% depending on feed pH, ionic strength and the specific element chemistry (per ASTM D4194-03 and manufacturer datasheets).
Operating pressure is the second axis that separates NF from its neighbours. Industrial NF systems run at 5–20 bar, against 15–30 bar for brackish RO and below 3 bar for UF. That pressure window translates directly into specific energy demand: NF consumes 0.3–0.8 kWh/m³ of permeate versus 0.8–1.5 kWh/m³ for RO (HydropureWater field data, 2026), a 40–50% reduction that is the strongest single argument for choosing NF when monovalent desalination is not the goal.
That energy advantage maps onto a specific application set: water softening without full desalination, sulfate and fluoride reduction, dye and pesticide removal in textile and agrochemical streams, partial TDS reduction for industrial reuse, and pre-RO polishing where NF lowers scaling potential on the RO stage. If the design problem is suspended solids, UF is the correct tool; if it is monovalent desalination, RO is. NF is the answer when divalent salts and 200–1000 Da organics must be cut but monovalent pass-through is acceptable or desirable.
The Six Core Nanofiltration Design Parameters
NF system sizing collapses to six parameters that every design engineer must lock down before a vendor conversation: flux, transmembrane pressure (TMP), recovery, MWCO, crossflow velocity, and feed silt density index (SDI). The table below consolidates the industrial operating windows. The rest of this section explains why each range exists and how the parameters interact.
| Parameter | Industrial design range | Design point | Limit / failure mode |
|---|---|---|---|
| Flux (LMH) | 10–25 | 15–20 | Compaction, fouling, scale if pushed too high |
| TMP (bar) | 3–30 | 10–20 | Element creep above 30 bar for standard 8-inch spiral-wound |
| Recovery (%) | 50–85 | 65–75 | CaSO₄, CaCO₃, SiO₂ scaling beyond design recovery |
| MWCO (Da) | 200–1000 | 300–500 | Loss of divalent rejection if MWCO is too loose |
| Crossflow (m/s) | 0.1–0.3 | 0.15–0.2 | Fouling below 0.1; pumping waste above 0.3 |
| Feed SDI₁₅ | < 3 | < 2 | Permanent flux loss above SDI 5 |
Flux is the most often mis-sized variable. Industrial design flux for spiral-wound NF sits at 10–25 L·m⁻²·h⁻¹ (LMH); a clean well-water feed will sustain 20–25 LMH, while a high-fouling stream such as textile dye bath or dairy effluent rarely holds above 12 LMH without aggressive antiscalant dosing and a CIP interval shorter than 30 days. Transmembrane pressure is not an independent setpoint — it is the dependent variable the pump must deliver to hold design flux as fouling builds. The flux–TMP curve, plotted weekly during a pilot, is the single best diagnostic for fouling: a rising TMP at constant flux is concentration polarization or scaling; a rising TMP with falling flux is fouling or compaction.
Recovery is bounded by scaling potential. At 75% recovery on a 2,000 mg/L feed, the concentrate is already at 8,000 mg/L — well past the solubility limits of CaSO₄ and most silica species. Always run the scaling indices (LSI, S&DSI) at the design recovery before committing to a number. MWCO selection is a trade-off: tighter cut-off (200–300 Da) gives higher divalent rejection and better organic removal but lower flux and higher TMP at fixed pressure. Crossflow velocity of 0.1–0.3 m/s in spiral-wound elements is the band that balances fouling control against pumping energy; below 0.1 m/s, concentration polarization dominates; above 0.3 m/s the energy penalty outweighs the marginal flux gain. Finally, always normalize flux to 25 °C using the 2–3% per °C correction factor built into every manufacturer projection tool — a 15 °C swing between winter and summer feed is a 30–45% flux shift that will quietly break an undersized system.
Feed Water Chemistry and Pretreatment Requirements
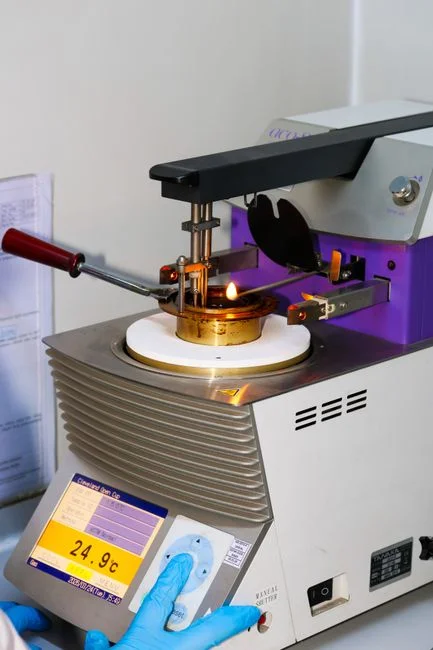
Most NF failures are not membrane or pump failures — they are pretreatment failures. The feed limits a designer must hit before the high-pressure pump are non-negotiable for spiral-wound elements, and every one of them is in the inlet water specification sheet for a reason.
Silt Density Index (SDI₁₅) must be below 3 for spiral-wound NF, with a design target below 2 (per ASTM D4189-14). Legacy documentation that accepts SDI < 5 is referring to older fouling-resistant RO elements and does not apply to standard thin-film composite NF. Turbidity should be below 1 NTU, achieved through a multi-media pretreatment filter or, where particulate load is high, an ultrafiltration stage ahead of the NF rack. Free chlorine must be below 0.1 mg/L continuously and below 0.5 mg/L cumulatively — standard polyamide NF membranes are not chlorine-tolerant, and oxidation damage is irreversible. Sodium bisulfite (SBS) dosing through an automatic chemical dosing skid, or activated carbon polishing, is mandatory whenever the feed carries any residual oxidant.
Iron must be below 0.05 mg/L and manganese below 0.02 mg/L; oxidation of either across the membrane surface produces hydroxide fouling that no CIP cycle will fully remove. Oil and grease must be below 0.1 mg/L — even trace hydrocarbon films collapse the membrane's salt rejection. pH must stay inside the 2–11 window typical of polyamide NF; outside that range, amide bond hydrolysis accelerates and rejection drifts permanently. Before any recovery target is fixed, calculate the Langelier Saturation Index (LSI) and the Stiff & Davis Stability Index (S&DSI) at the projected concentrate composition — a 75% recovery is only feasible if the scaling indices stay below 0 at the concentrate pH and temperature, with the antiscalant dose included.
NF vs UF vs RO: A Parameter-Level Comparison
Selection between NF, UF and RO is a parameter-level decision, not a brand decision. The table below places the three technologies on the same axes so a process engineer can defend a choice to a project reviewer without leaning on vendor language.
| Parameter | UF | NF | Brackish RO |
|---|---|---|---|
| Pore size / MWCO | 0.01–0.1 µm / 1,000–500,000 Da | 0.5–2 nm / 200–1000 Da | < 0.5 nm / < 200 Da |
| Operating pressure | 0.5–3 bar | 5–20 bar | 15–30 bar |
| Design flux | 40–80 LMH | 10–25 LMH | 15–30 LMH |
| Monovalent rejection | 0% | 20–80% | 95–99% |
| Divalent rejection | 0% | 90–99% | 99%+ |
| Energy (kWh/m³) | 0.05–0.2 | 0.3–0.8 | 0.8–1.5 |
| Typical application | Suspended solids, turbidity, NOM | Hardness, sulfate, dyes, organics 200–1000 Da | Full desalination, boiler feed, high-purity reuse |
The energy gap is the operational decision driver. NF at 0.3–0.8 kWh/m³ is roughly half the specific energy of RO; UF is an order of magnitude below both, but it removes nothing dissolved. The decision rule is simple: choose UF when only suspended solids, colloids and high-MW organics need removal; choose NF when divalent salts and 200–1000 Da organics are the target and some monovalent pass-through is acceptable; choose RO when the permeate specification demands < 500 mg/L TDS or the discharge/reuse limit requires near-zero monovalent salt.
For pre-RO placement, NF is increasingly the standard architecture in high-recovery reuse trains. An NF softening stage ahead of an industrial RO system strips hardness and sulfate, which lifts overall system recovery by 5–10 percentage points and lengthens RO CIP intervals by 30–50% (HydropureWater field data, 2026). For a deeper read on how RO and UF compare on the same axes, see the RO vs UF technical comparison.
Step-by-Step NF System Sizing Workflow
A repeatable sizing workflow is the difference between a defensible design and a vendor-driven one. The five-step sequence below is what a process engineer should run before any commercial engagement.
- Characterize the feed. Pull representative samples across all shifts and seasons. Required parameters: TDS, hardness (Ca²⁺, Mg²⁺), alkalinity, sulfate, chloride, silica, iron, manganese, free chlorine, turbidity, SDI₁₅, temperature, and total organics (TOC or COD). Variability matters as much as averages — a feed that swings from 500 to 3,000 mg/L TDS will size differently from a stable 1,500 mg/L feed.
- Set target recovery and permeate quality, then run a projection. Use the manufacturer's projection tool (WinFlows, ROSA, or equivalent) to check scaling indices at the design recovery and worst-case concentrate composition. If LSI or S&DSI exceeds zero, lower recovery, add antiscalant, or both — do not skip this step.
- Select membrane chemistry. Polyamide thin-film composite (TFC) is the default for most industrial feeds. Sulfonated variants give higher rejection of multivalent organic dyes and pharmaceuticals; loose NF (MWCO 800–1000 Da) suits pretreatment polishing where divalent removal is the only goal.
- Size elements and vessels. Target design flux of 10–25 LMH at the projected TMP, then back-calculate the membrane area required and divide by the area per 8-inch element (typically 35–40 m²). Vessel loading for industrial 8-inch elements runs 1–6 per vessel; high-fouling feeds stay at 1–2, clean feeds push to 4–6.
- Design the pretreatment train and pilot. Lock SDI₁₅ < 3 and free chlorine < 0.1 mg/L as inlet guarantees. Any new feedwater — a well, a surface source, a process wastewater — must go through a 4–12 week pilot on a single element or a single 4-inch vessel before commercial commitment. There is no shortcut.
Operating Cost and Energy Reality for NF in 2026
Energy dominates NF OPEX at 0.3–0.8 kWh/m³ of permeate; selecting a high-efficiency pump and a properly sized energy-recovery device on the concentrate stream cuts this 15–25% in most installations (HydropureWater field data, 2026). Membrane replacement runs 10–20% of element inventory per year under normal operation, and rises sharply when SDI or chlorine excursions occur — the cheapest insurance is pretreatment compliance, not longer element life. Chemical consumption is modest: antiscalant at 2–10 mg/L of feed, plus CIP chemicals (caustic + acid) for 1–4 cleaning cycles per year depending on feed fouling potential. Embed both line items in the OPEX model up front.
On the CAPEX side, industrial NF systems from qualified manufacturers run USD 800–2,500 per m³/day of installed capacity in 2026, with the wide range driven almost entirely by pretreatment complexity — a clean well-water feed sits at the bottom of the band, while a textile or landfill leachate application that needs UF + activated carbon + NF will sit near the top. For guidance on trimming chemical OPEX, the chemical dosing cost optimization guide walks through antiscalant selection and dosing setpoint logic, and the broader 2026 water reuse market drivers piece places these economics in the current industrial context.
Frequently Asked Questions
What flux should I design an industrial NF system at? Design at 10–25 LMH, with 15–20 LMH as the conservative mid-range. Push toward 20–25 LMH only on clean, low-fouling well-water feeds; drop to 10–12 LMH on textile, dairy, or any feed with an SDI₁₅ above 2.5 even after pretreatment.
What recovery is realistic for NF? 50–85% is the operating envelope, with 65–75% the most common industrial design point. Above 75%, calcium sulfate and silica scaling dominate and CIP frequency rises sharply. Always verify with a scaling-index projection at the design recovery before committing.
Can NF replace RO? Only when the permeate specification does not require monovalent desalination. NF rejects 90–99% of divalent ions but lets 20–80% of monovalent ions through; if the reuse or discharge target is < 500 mg/L TDS, NF is not a substitute — but NF as a pre-RO softening stage frequently outperforms either technology alone.
What feed SDI is required for spiral-wound NF? SDI₁₅ below 3, with a design target below 2. SDI < 5 is not acceptable for standard thin-film composite NF elements regardless of what older specification sheets may say.
How do I handle chlorine in the feed? Most polyamide NF membranes tolerate < 0.1 mg/L free chlorine continuously. Dechlorinate with sodium bisulfite (typical 1.5–3 mg SBS per mg Cl₂) via an automatic chemical dosing skid, or polish through activated carbon. Never assume municipal or process water is chlorine-free without a measurement on the inlet.
Related Equipment
- MBR bioreactor — specifications, capacity range, and technical data