Why Chemical Dosing Is the Largest Controllable OPEX Line
Chemical dosing consumes 20-35% of total wastewater plant operating expenditure in most municipal and industrial WWTPs audited between 2024 and 2026, making it the single largest controllable cost line ahead of energy and sludge hauling (HydropureWater field data, 2025-2026; consistent with EPA Clean Watersheds Needs Survey OPEX breakdowns, 2024-2025 reporting cycle). Within that envelope, inorganic coagulants — primarily polyaluminum chloride (PAC) and aluminum sulfate (alum) — account for 40-60% of chemical spend, organic polymers (cationic, anionic, and nonionic polyacrylamide) take 15-25%, pH adjusters (NaOH, H₂SO₄, lime) 10-20%, and specialty reagents (defoamers, scale inhibitors, nutrient sources) 5-15%.
Manual operators almost universally dose 15-30% above the jar-test optimum to absorb influent variability and avoid permit excursions. On a $200K/year chemical budget, that safety margin is $30K-$60K of coagulant flushed straight into the sludge train — and into the hauling contract. Static dose rates fail because the underlying process is multivariate: a 2024 MDPI model-based reinforcement learning (MBRL) study mapped 15 process states to 6 effluent indicators across a 227-record training set and demonstrated that single-setpoint control underperforms on roughly 40% of operating days even at well-instrumented plants (MDPI, 2024). Optimization is not optional — it is the only way to convert a volatile cost line into a predictable one without raising compliance risk.
The Four Levers for Chemical Dosing Cost Optimization
Cost reduction in chemical feed comes from four engineering levers, each addressing a different failure mode. Pulling all four typically delivers 15-30% coagulant savings; pulling only one delivers 5-10%.
Lever 1 — Dose precision. Replacing manual ball-valve feed with metering pumps at ±1% stroke accuracy eliminates 8-15% of the over-dose safety margin because the setpoint becomes repeatable. PLC-controlled automatic chemical dosing systems combine this pump accuracy with flow-paced output, so a 20% drop in influent flow automatically trims the chemical feed proportionally rather than waiting for an operator to notice the weir.
Lever 2 — Real-time control. Streaming current detectors (SCD), pH probes, ORP sensors, and inline turbidity meters feed a feedback loop that corrects dose every 10-30 seconds. Feed-forward control uses influent flow and turbidity to set the lead dose; the SCD trims the residual. This cascade structure typically pulls another 5-10% of chemical waste out of the system because it tracks load in real time instead of averaging against yesterday's shift.
Lever 3 — Chemical activation and mixing. Aged polymer solution (held more than 24-48 hours) loses 5-10% of its active charge, and poor flash mixing throws another 5% of reagent into the overflow. Static mixers sized for 1-3 seconds of contact time and a maturation chamber with 20-45 minutes of hydraulic residence recover most of that loss. For polymer-heavy operations, automatic make-down units that prepare fresh solution on demand eliminate aging entirely.
Lever 4 — Sludge synergy. Pairing dosing optimization with a high-rate sedimentation step changes the chemical demand curve. High-efficiency sedimentation tanks built on lamella-plate geometry improve floc settling velocity by a factor of 3-5 versus conventional clarifiers, which reduces polymer demand by up to 30% (HydropureWater product data, 2025) because larger, denser flocs form under the same dose. The 2026 frontier is digital-twin optimization layered on top of the four mechanical levers: the same MDPI 2024 MBRL study showed a well-tuned PLC system delivers 60-70% of theoretical savings, with a reinforcement-learning layer capturing the remaining 20-30% by adapting setpoints to daily and seasonal load patterns.
Coagulant and Polymer Price Benchmarks for 2026
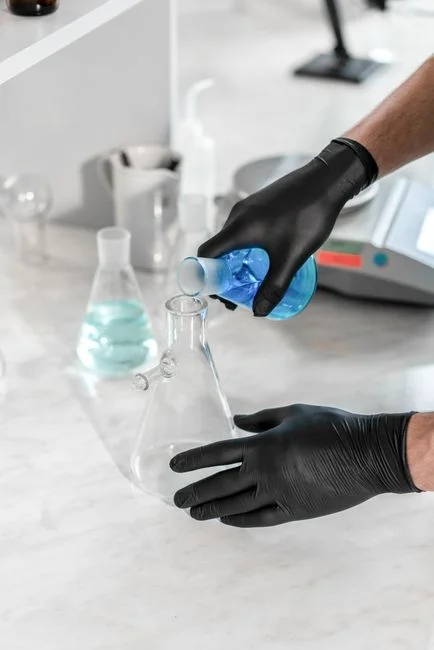
Procurement engineers need a price-of-money reference before they can model savings. The table below uses industry-reported 2026 ranges for the four chemical categories that drive dosing OPEX in industrial WWTPs (textile, food and beverage, metal finishing). All pricing is per kilogram of active product, FOB industrial warehouse, in USD.
| Chemical | 2026 price range (USD/kg active) | Typical dose (mg/L) | Primary function |
|---|---|---|---|
| Polyaluminum chloride (PAC, 10% Al₂O₃) | $0.35 – $0.65 | 50 – 300 | Turbidity, color, phosphate removal |
| Aluminum sulfate (alum, 17% Al₂O₃) | $0.25 – $0.45 | 75 – 350 | Turbidity, phosphorus precipitation |
| Anionic polyacrylamide (PAM, 90% active) | $2.50 – $4.80 | 1 – 10 | Flocculant aid, sludge dewatering |
| Cationic polyacrylamide (CPAM, 90% active) | $3.20 – $5.80 | 2 – 15 | Sludge conditioning, emulsion break |
| Caustic soda (NaOH, 50%) | $0.40 – $0.70 | 20 – 150 | pH adjustment for coagulant efficiency |
| Sulfuric acid (H₂SO₄, 98%) | $0.15 – $0.30 | 15 – 100 | pH suppression for metals precipitation |
Translated into operating cost: a 200 m³/h plant dosing 150 mg/L of PAC at $0.50/kg spends roughly $360/day on coagulant — about $131K/year at single-shift loading, before polymers and pH correction. A 20% dose reduction at that plant equals $26K/year in chemical savings alone, before factoring in lower sludge output and reduced hauling. pH adjusters rarely exceed 5% of total spend, but they control downstream coagulant efficiency: a swing of 0.5 pH units can move PAC demand by 10-20%.
Dosing Technology Comparison: Manual, Pneumatic, and PLC Systems
Choosing the right control tier matters more than choosing the right brand. The decision is driven by flow rate, influent variability, and the cost of a permit excursion. The table below compares the four architectures a 2026 buyer will actually see in vendor quotes.
| System type | Dose accuracy | Installed cost (USD) | Best-fit flow range | Real-time control |
|---|---|---|---|---|
| Manual ball-valve feed | ±5 – 10% | $3,000 – $8,000 | Below 20 m³/h, stable influent | None |
| Solenoid metering pump (single head) | ±2% | $4,000 – $15,000 | Below 30 m³/h, low variability | Pulse-paced only |
| Pneumatic diaphragm metering pump | ±3% | $8,000 – $20,000 | 30 – 300 m³/h, hazardous/abrasive slurries | None (stroke-length trim) |
| PLC automatic dosing skid | ±1% | $25,000 – $90,000 | 30 – 1,000 m³/h, variable load | Flow-paced + SCD feedback + SCADA |
The automatic chemical dosing skid tier is the only one that integrates flow pacing, sensor feedback, and remote SCADA in a pre-wired package — which is why it dominates new installations above 30 m³/h. Decision rule for procurement: flows below 30 m³/h with stable influent can run on solenoid pumps; 30-300 m³/h with variable load needs a PLC skid; hazardous-area or abrasive slurries (e.g., lime slurry, high-solids polymer) need pneumatic diaphragms regardless of flow. The MDPI 2024 study is worth flagging here: even a well-tuned PLC skid only delivers 60-70% of theoretical optimization, because PLC control is reactive. A digital-twin or model-based reinforcement-learning layer trained on the plant's own historical data adds the remaining 20-30% by anticipating load swings rather than correcting them after the fact.
Online Sensors and Control Loops That Drive Optimization
Dosing hardware without sensors is just a more accurate way to over-feed. The instrumentation stack below is the minimum viable sensor set for a coagulant-and-polymer optimization loop, with 2026 installed-price ranges.
Streaming current detector (SCD). The gold-standard sensor for coagulant dose control. Response time under 10 seconds, installed cost $6K-$14K including probe and analyzer. SCD measures the electrokinetic charge on colloidal particles after coagulant addition and gives the PLC a continuous residual-charge signal that maps directly to dose sufficiency. One SCD per coagulant feed point is the standard configuration.
pH probe with automatic temperature compensation. $1.2K-$3K installed. Required for any acid or caustic feed loop, and critical for coagulant efficiency — a 0.5-unit pH drift can shift PAC demand 10-20%. Install upstream of the coagulant injection point with a self-cleaning retractable holder.
Inline turbidity meter (nephelometric). $3K-$8K. Used for polymer dose trim and for effluent compliance check. Range 0-1,000 NTU covers most industrial influent conditions; high-range probes (0-10,000 NTU) are needed for raw textile or food-processing wastewater.
Magnetic flow meter on the chemical feed line. $2K-$5K. Gives the PLC a measured dose rate in L/h rather than a calculated setpoint from pump stroke, eliminating calibration drift over time. A coriolis or mag meter on the carrier-water line is a common upgrade for polymer systems.
The cascade is straightforward: influent flow and turbidity feed the lead dose (feed-forward), SCD output trims the residual (feedback), and pH ensures the chemistry is in the right window. The broader automation stack — SCADA, ORP, predictive maintenance — is covered in the SCADA integration guide for dosing skids and the ORP sensor selection guide. Without this loop closed, the dosing skid is just an expensive pump.
ROI and Payback Calculation for an Optimization Retrofit
The financial case for an optimization retrofit compresses fast in 2026 because polymer and PAC prices are running 8-12% above 2024 levels on supply-side pressure. Worked example for a 200 m³/h textile WWTP running 18 hours/day, 300 days/year:
Baseline. PAC dose 220 mg/L at $0.50/kg active, manual control with 18% over-dose. Annual PAC spend: 200 m³/h × 18 h × 300 d × 220 mg/L × $0.500/kg × 10⁻⁶ × 1.18 = $140,256 in chemical cost, plus polymer at $36K, pH adjuster at $17K, and total chemical OPEX of about $193K/year. Sludge hauling runs another $48K/year, of which roughly 60% is driven by over-dose chemical ending up as solids.
Optimized state. PLC dosing skid with SCD feedback trims PAC to 180 mg/L (an 18% dose reduction), polymer to 7 mg/L (a 12% reduction), and reduces sludge volume by 15%. Annual chemical cost drops to about $158K, sludge hauling drops to $40K. Net annual savings: $35K chemical + $8K hauling = $43K/year.
CAPEX. PLC dosing skid (three pump heads, mag meters, calibration column): $60K. SCD + pH + turbidity instrumentation: $18K. Installation, SCADA integration, and commissioning: $22K. Total project: $100K.
Payback. $100K ÷ $43K/year = 2.3 years on flat chemical prices. With 2026 polymer price inflation running 8-12% year-over-year, payback compresses to under 18 months on the same hardware. A 15% PAC price increase — plausible given 2026 aluminum supply constraints — lifts annual savings to about $50K and pulls payback to 2.0 years even on a 10-year cost-of-capital hurdle. Predictive maintenance on the dosing skid extends pump diaphragm life from 18 to 30+ months and cuts unplanned chemical-feed downtime by roughly 40% (see the predictive maintenance for dosing systems guide). For plants already running an MVR evaporator or constructed wetland, the same OPEX-framework logic in the MVR evaporator operating cost breakdown applies — fixed cost lines scale with throughput, so any dose reduction flows directly to the bottom line.
Implementation Roadmap and Supplier Selection Checklist
Optimization retrofits fail most often in the first four weeks — when the dose audit and jar testing should anchor every later decision. The phased roadmap below is what a 2026 procurement engineer should plan against.
| Phase | Timeline | Key activities | Deliverable |
|---|---|---|---|
| 1. Audit and jar testing | Weeks 1-4 | Influent and dose audit; jar tests to confirm optimal coagulant; baseline OPEX measurement | Baseline report + target dose envelope |
| 2. Specification and vendor comparison | Weeks 5-10 | Equipment spec; vendor comparison on accuracy, ATEX rating, SCADA protocol support | Approved vendor shortlist |
| 3. Installation and tuning | Weeks 11-16 | Install, loop tuning, operator training; 2-4 week shadow run before automatic control | Commissioned system + trained operators |
| 4. Verification | Weeks 17-20 | 30-day performance verification against baseline; CAPEX/OPEX reconciliation | Verified savings report |
Supplier checklist items that separate a serious vendor from a pump reseller: certified dosing accuracy on the skid (not just the pump head spec, which is the empty-meter accuracy); local service footprint with guaranteed 72-hour spare-parts lead time; PLC brand openness — Allen-Bradley, Siemens, or documented open-source support, not a locked proprietary controller; and documented SCADA protocol support (Modbus TCP, EtherNet/IP, or PROFINET) so the skid drops into the existing plant network without a gateway. The pre-engineered automatic chemical dosing skid option shortens Phase 3 to roughly 2 weeks because the panel arrives loop-tested, which matters for plants where every hour of dosing downtime is a permit risk. For plants in West Africa or other regions where local integration support is thin, the Ghana-market wastewater plant supplier guide lays out the same selection framework for a different supply-chain context. With 2026 cost pressures — MBBR media replacement, polymer price inflation, tighter effluent limits — dosing optimization is now a higher-priority retrofit than clarifier upgrades or aeration trimming for most industrial plants above 50 m³/h.
Frequently Asked Questions
What is the typical payback period for an automatic chemical dosing system? For industrial plants above 50 m³/h, payback runs 9-18 months at 2026 chemical prices when a PLC dosing skid is paired with SCD and pH feedback, and 18-30 months for the same skid without sensor feedback.
Which sensor is best for coagulant dose control? The streaming current detector (SCD) is the gold standard, with sub-10-second response and a direct mapping to coagulant residual charge; pair it with a pH probe for any application where influent pH varies by more than ±0.5 units.
What dose-reduction range is achievable with PLC control? PLC-controlled dosing with sensor feedback typically cuts coagulant consumption 15-30% versus manual feed; adding a digital-twin or model-based reinforcement-learning layer captures an additional 10-15% on top of that.
Is an automatic dosing skid compatible with existing SCADA? Yes — modern skids ship with Modbus TCP, EtherNet/IP, or PROFINET and can be mapped into Allen-Bradley, Siemens, or open-source SCADA stacks without a protocol gateway, provided the supplier confirms protocol support before purchase.
What is the maintenance burden of a PLC dosing skid? Planned maintenance runs 4-6 hours per month: pump diaphragm inspection, calibration verification, and sensor probe cleaning; with predictive maintenance enabled, unplanned chemical-feed downtime drops by roughly 40% compared to a manual system.