2026 Market Size and Growth Forecast
The decentralized wastewater treatment market is forecast at roughly $39.7 billion in 2026, expanding at a 7.1% CAGR from 2024 to 2030 (Grand View Research, 2025-published estimate). The 2024 base year sits at $32.4 billion, and the projected 2030 value is $52.6 billion, implying a near-doubling over a six-year window. Compared with the centralized municipal wastewater treatment market at approximately $285 billion in 2026, decentralized is the faster-growing slice at roughly 2.5× the centralized growth rate, a structural shift driven by small-community, commercial, and industrial off-sewer demand rather than greenfield trunk-sewer expansion.
Market scope follows the standard citable definition: integrated and efficient point source sewage treatment equipment serving small communities, resorts, commercial sites, and industrial facilities not connected to a centralized collection network. Packaged plants, containerized units, on-site sewage treatment systems, and small community WWTPs below roughly 5,000 PE all sit inside this perimeter. Decentralized does not mean temporary or low-spec; the 2026 procurement default is a skid-mounted, PLC-controlled, factory-tested unit with documented effluent compliance.
| Metric | Value (2026) | Source / Note |
|---|---|---|
| Decentralized market value | $39.7B (range $38–42B) | Grand View Research, 2025 |
| 2024 base year value | $32.4B | Grand View Research, 2025 |
| 2030 projected value | $52.6B | Implied from 7.1% CAGR |
| CAGR 2024–2030 | 7.1% | Grand View Research, 2025 |
| Centralized market value (comparison) | ~$285B | 2026 industry estimate |
| Relative growth multiple | ~2.5× | Decentralized vs. centralized CAGR |
Market Segmentation by Technology
Packaged MBR and MBBR together capture roughly 42% of 2026 decentralized revenue, the highest-margin sub-categories and the ones where Chinese manufacturers are gaining global share against EU/US incumbents. Packaged MBR holds approximately 22% of the market at $8.7B in 2026, growing fastest at 9.2% CAGR, driven by the 60% smaller footprint versus conventional activated sludge (referenced in packaged MBR systems designed for land development, resorts, and commercial applications) and by a 9.2% CAGR that puts it roughly 2 percentage points above the market average. MBBR / moving-bed biofilm reactor systems hold about 20% ($7.9B), preferred for sites that need robust biology without the membrane replacement cycle. SBR / sequencing batch reactors sit at 15% ($6.0B) and dominate the small-municipal sub-5,000 PE sub-segment where operators want familiar control logic. Constructed wetlands and natural systems account for roughly 12% ($4.8B), usually the lowest-OPEX option where land is available. Conventional septic and extended-aeration packaged units make up the remaining 31% ($12.3B), the largest single bucket by revenue but the slowest-growing as sites modernize.
Real-world validation of the packaged MBR archetype is visible in North American vendors such as Enereau, whose nrPUR MBR product line targets exactly the land-development, resort, and commercial niches that this 42% combined share describes. For buyers specifying the technology, DF series PVDF flat sheet membrane modules represent the typical 2026 component spec, with 0.1–0.4 µm nominal pore size and 8–12 m² per element. Related demand is documented in our Membrane Bioreactor Market Growth 2026: Size, Drivers & Outlook analysis.
| Technology Segment | 2026 Share | 2026 Value (USD) | CAGR 2024–2030 |
|---|---|---|---|
| Packaged MBR | ~22% | $8.7B | 9.2% |
| MBBR / moving-bed biofilm | ~20% | $7.9B | 7.5% |
| SBR / sequencing batch | ~15% | $6.0B | 5.8% |
| Constructed wetlands & natural systems | ~12% | $4.8B | 4.2% |
| Conventional septic / extended-aeration packaged | ~31% | $12.3B | 3.1% |
Market Segmentation by Application and End-User
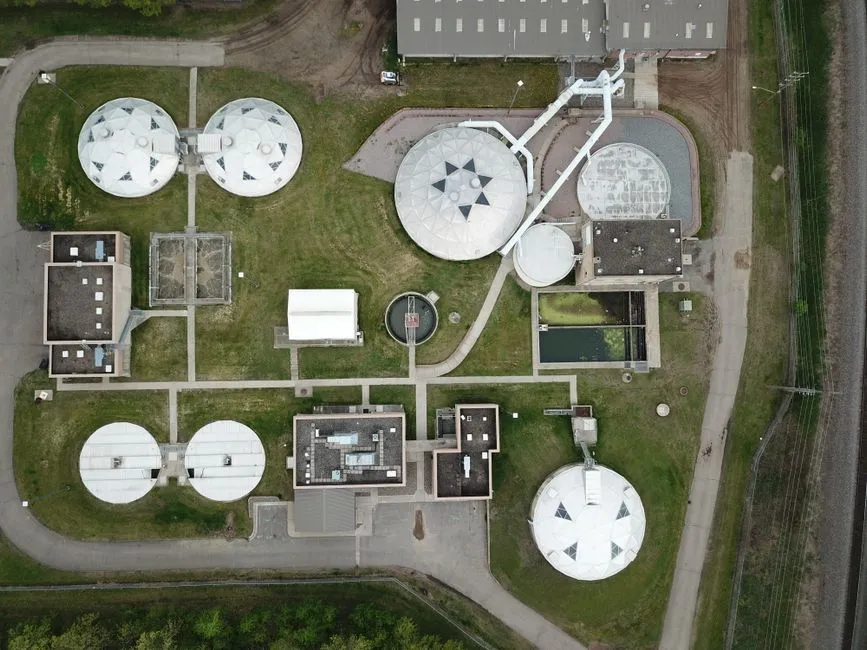
Residential clusters and rural communities are the largest single revenue bucket at roughly 34% of 2026 spend ($13.5B), driven by China's rural revitalization rollout, India's AMRUT 2.0, and US EPA decentralized system funding for unsewered subdivisions. Commercial applications, including the land development, resorts, hotels, hospitals, and schools explicitly listed on the Enereau product page, account for 24% ($9.5B) and tend to be the highest-margin sub-segment because buyers prioritize fast installation and certified reuse-quality effluent. Industrial decentralized treatment, food, textile, semiconductor, petrochemical, and remote oil & gas camps, holds 28% ($11.1B) and is the fastest-growing vertical at 8.6% CAGR as ESG-driven ZLD and water-reuse mandates push facilities off the municipal grid. Small municipal plants under 5,000 PE round out the market at 14% ($5.6B).
Hospitals and clinics are a compliance-driven niche inside the commercial bucket. Specifiers in this segment typically require packaged plants with documented performance against the EU UWWTD 91/271/EEC discharge envelope, served by product lines such as the medical wastewater series. For unsewered residential subdivisions, the typical 2026 specification is the underground package sewage treatment plant with buried-tank architecture, noise below 45 dB(A) at 10 m, and a PLC control panel that can be commissioned in under 48 hours.
Regional Market Breakdown and Hotspots
North America and Asia-Pacific are tied as the largest 2026 regional markets at roughly 29% each, with Europe at 24%, MEA at 9%, and LATAM at 9%. The dollar split is therefore North America $11.6B, Asia-Pacific $11.4B, Europe $9.5B, MEA $3.6B, and LATAM $3.6B. The interesting story is not the rank order but the growth divergence: APAC grows fastest at 8.4% CAGR, MEA follows at 7.8%, North America at 7.0%, LATAM at 6.5%, and Europe at 5.9% on a larger installed base.
APAC growth is anchored by China's rural revitalization program, which targets 90% township-level wastewater treatment coverage by 2026, and India's AMRUT 2.0 scheme covering 4,800+ towns. EU growth, while slowest in percentage terms, is driven by the UWWTD recast (2024 proposal) extending treatment requirements to agglomerations under 2,000 PE, historically exempt, which adds an estimated $1.2B incremental EU TAM by 2027. MEA growth comes from Saudi Vision 2030 giga-projects (NEOM, Red Sea, AMAALA) and UAE industrial parks that require on-site treatment for resorts and remote camps, a market segment we cover in detail in our Industrial Wastewater Treatment in Saudi Arabia: 2026 Engineering Guide with Costs, Compliance & Equipment Selection. North America is supported by US EPA decentralized system capacity-building grants exceeding $1B cumulatively over 2023–2026.
| Region | 2026 Share | 2026 Value (USD) | CAGR 2024–2030 | Key Regulatory Driver |
|---|---|---|---|---|
| North America | ~29% | $11.6B | 7.0% | EPA decentralized grants, Clean Water Act SRF |
| Asia-Pacific | ~29% | $11.4B | 8.4% | China rural revitalization, India AMRUT 2.0 |
| Europe | ~24% | $9.5B | 5.9% | UWWTD recast (2024 proposal) |
| Middle East & Africa | ~9% | $3.6B | 7.8% | Saudi Vision 2030, UAE industrial parks |
| Latin America | ~9% | $3.6B | 6.5% | Brazilian PRODES, Mexican NOM-001 |
Technology Drivers Shaping the 2026 Market
Four structural drivers justify the 7.1% CAGR and confirm that 2026 demand is not a temporary spike. Driver 1 — water scarcity: 2 billion people live in water-stressed regions (UN 2024), pushing decentralized reuse over single-pass discharge. Driver 2 — regulatory tightening: the EU UWWTD recast, US EPA decentralized system capacity-building grants exceeding $1B over 2023–2026, and China's GB 18918 tightened effluent limits for small communities all converge on the same 2026 procurement cycle. Driver 3 — cost parity: packaged MBR CAPEX of $180–$620 per m³/day now beats centralized sewer extension when collection distance exceeds ~3 km, a breakpoint that has moved roughly 800 m closer to the site since 2017 as centralized construction inflation outpaces packaged-plant inflation. Driver 4 — ESG and Scope 3 water reporting: multinational manufacturers and resort operators now procure decentralized reuse systems to hit 2030 water-intensity targets, with water reuse demand detailed in Water Reuse Market Drivers 2026: Industrial Outlook & Tech Trends.
For sites with high TSS, FOG, or fiber loadings, the standard 2026 pretreatment step is a DAF pre-treatment unit ahead of the biological stage. This combination keeps MBR membrane fouling rates at design levels and extends cleaning intervals to 6–9 months.
Cost Benchmarks for Decentralized Plants in 2026
Packaged MBR and MBBR systems below 500 m³/day capacity carry a 2026 installed CAPEX range of $180–$620 per m³/day, updated from the 2017 cost functions published in Top 2/3 academic sources and escalated by ~28% cumulative engineering inflation since 2017. OPEX runs $0.06–$0.18 per m³ for MBBR plants and $0.08–$0.22 per m³ for MBR plants; the MBR premium reflects membrane aeration, periodic chemical cleaning (typically 300–500 ppm NaOCl every 6–9 months), and 5–7 year membrane replacement. Sludge yield of 0.15–0.25 kg DS/kg COD removed determines whether a downstream plate-and-frame filter press or decanter centrifuge is required for sites above 200 m³/day.
OPEX below $0.10/m³ is only achievable when influent BOD/COD is below 500 mg/L. Higher-strength industrial decentralized plants, those integrated point source treatment systems referenced in the standard market definition, typically run at 2–3× the per-m³ cost because of nutrient removal (TN <15 mg/L, TP <0.5 mg/L) and stricter reuse targets.
| Parameter | MBR (2026) | MBBR (2026) | Note |
|---|---|---|---|
| CAPEX (installed, <500 m³/day) | $180–$620/m³/day | $150–$480/m³/day | Excludes land and civil works |
| OPEX | $0.08–$0.22/m³ | $0.06–$0.18/m³ | Includes energy, chemicals, labor |
| Energy intensity | 0.8–1.4 kWh/m³ | 0.4–0.8 kWh/m³ | Membrane aeration dominates MBR |
| Sludge yield | 0.15–0.25 kg DS/kg COD | 0.20–0.30 kg DS/kg COD | Drives dewatering choice |
| Footprint vs. CAS | ~40% (60% reduction) | ~55% (45% reduction) | Site-limited applications |
What 2026 Market Growth Means for Equipment Vendors
The 7.1% CAGR creates a clear four-rule decision framework for equipment vendors. Rule 1 — region: target APAC and MEA for volume growth (8.4% and 7.8% CAGR respectively), target EU and North America for premium MBR and reuse-driven project value. Rule 2 — scope: bundle primary treatment with biological treatment and sludge dewatering to capture roughly 3× the project value versus biological-only bids; vendors that quote just the MBR or MBBR skid leave money on the table. Rule 3 — form factor: standardize on skid-mounted, PLC-controlled, containerized packages; this is the 2026 procurement default for resorts, remote sites, and fast-track industrial deployments, with containerized wastewater treatment as the fastest-growing sub-format. Rule 4 — documentation: build compliance evidence (EPA, EU UWWTD, GB 18918, WHO) into product datasheets; 2026 buyers increasingly filter vendors on documentation depth, not just price.
Common 2026 bid configurations pair an automatic chemical dosing system for nutrient polishing with a high-efficiency sedimentation tank for primary clarification, then an MBR or MBBR for biological treatment, then a plate press for dewatering. This three-stage bundle is the dominant 2026 specification outside the pure-small-municipal SBR niche.
Frequently Asked Questions
How big is the decentralized wastewater treatment market in 2026? The market is forecast at roughly $39.7 billion in 2026, expanding at a 7.1% CAGR from a 2024 base of $32.4 billion to a projected $52.6 billion by 2030 (Grand View Research, 2025).
Which technology segment is growing fastest in decentralized wastewater treatment? Packaged MBR is the fastest-growing technology segment at 9.2% CAGR, driven by a roughly 60% smaller footprint versus conventional activated sludge and by tightening reuse-quality effluent standards in EU and APAC.
What is the largest regional market for decentralized wastewater treatment in 2026? North America and Asia-Pacific are tied as the largest 2026 regional markets, each at approximately 29% of global spend ($11.6B and $11.4B respectively).
What CAPEX per m³/day should I expect for a packaged decentralized WWTP in 2026? Packaged MBR and MBBR systems below 500 m³/day carry an installed CAPEX of $180–$620 per m³/day in 2026, beating centralized sewer extension once collection distance exceeds approximately 3 km.
How does the EU UWWTD recast affect the 2026 decentralized wastewater market? The 2024 UWWTD recast proposal extends treatment requirements to agglomerations under 2,000 PE, historically exempt, unlocking an estimated $1.2B in incremental EU decentralized TAM by 2027.