What Drives the Cost of an Automotive Wastewater Treatment Plant in 2026
Automobile manufacturing wastewater treatment cost in 2026 spans $50,000 to $5,000,000 in CAPEX and $0.18 to $1.40 per cubic meter in OPEX, a 100× range that maps directly onto four plant-specific variables: daily flow rate, influent COD and heavy-metal load, the discharge-versus-reuse endpoint, and whether zero liquid discharge (ZLD) is mandated (per LinkedIn WTP guide, 2025-09). The same source confirms a 100× CAPEX band, which signals that a budget memo built on the midpoint is unsupportable; a tier-2 parts supplier at 30 m³/day and an OEM at 6,000 m³/day with ZLD do not share an equipment class.
Start with water footprint: automotive production consumes 52–83 m³ of process water per vehicle, with >95% consumed in production (YASA ET reference design). A 100,000-vehicle/yr plant therefore generates 5,200,000–8,300,000 m³/yr of process wastewater — the single largest driver of equipment sizing.
Five streams feed a typical automotive effluent matrix: paint shop (overspray, solvents, rinse water; COD 800–3,000 mg/L), phosphating (nickel 1–20 mg/L, zinc 5–50 mg/L, phosphate 20–100 mg/L), machining (oil & grease 200–2,000 mg/L, emulsified cutting fluids), assembly (general wash, low load), and domestic sewage. The first three drive 70–80% of treatment cost because they force chemical precipitation, DAF pre-treatment, and tertiary polishing rather than simple biological oxidation.
The 2026 OPEX band of $0.18–$1.40/m³ derives from the YASA ET €0.004–€0.020/L figure (at 0.94 USD/EUR) plus Chinese/SE-Asian equipment-cost benchmarks for biological-only systems at the low end and MVR-equipped ZLD at the upper end. Plants targeting discharge-to-sewer sit at $0.18–$0.45/m³; closed-loop reuse pushes OPEX to $0.60–$1.00/m³; ZLD with MVR crystallizer reaches $1.00–$1.40/m³.
Influent Characteristics That Set the Treatment Train
Combined automotive + domestic wastewater from a Western China OEM benchmarks at 422 mg/L COD and 6.7 mg/L total phosphorus under the Springer 2024 SBR pilot, with effluent dropping to 50 mg/L COD and 0.8 mg/L TP (88.2% and 88.0% removal respectively, no chemical dosing). That single dataset is the most defensible 2024 biological baseline for sizing an SBR or MBR stage.
Paint shop wastewater is a different beast: TSS from overspray runs 500–1,500 mg/L, COD 800–3,000 mg/L, with trace VOCs from solvent-borne coatings. A biological stage alone will not pass an effluent spec on this stream — DAF plus chemical coagulation is mandatory, with a HydropureWater DAF system for oil & grease pre-treatment typically removing 90–95% of FOG at hydraulic capacities of 4–300 m³/h.
Phosphating rinse water carries the metals that trip up biological-only designs: zinc 5–50 mg/L, nickel 1–20 mg/L, phosphate 20–100 mg/L. These trigger a chemical precipitation step (lime or NaOH dosing to pH 9–10) followed by ion exchange or RO polishing if reuse is the endpoint.
Machining coolant waste introduces emulsified oil at 200–2,000 mg/L that breaks conventional biological treatment, which is why DAF is the universal first stage in any automotive effluent train (see the engineering guide to oily wastewater treatment).
| Stream | COD (mg/L) | Key Contaminant | Typical Range | Pre-Treatment Required |
|---|---|---|---|---|
| Paint shop (overspray/rinse) | 800–3,000 | TSS, VOCs, solvents | 500–1,500 mg/L TSS | DAF + coagulant |
| Phosphating line | 200–800 | Zinc, nickel, phosphate | Zn 5–50; Ni 1–20; PO₄ 20–100 mg/L | Chemical precipitation + DAF |
| Machining coolant | 2,000–10,000 | Emulsified oil & grease | 200–2,000 mg/L O&G | DAF (break + float) |
| Combined (Springer baseline) | 422 | Mixed domestic + industrial | TP 6.7 mg/L | Equalization + biological |
Process Selection: From DAF Pre-Treatment to ZLD Reuse
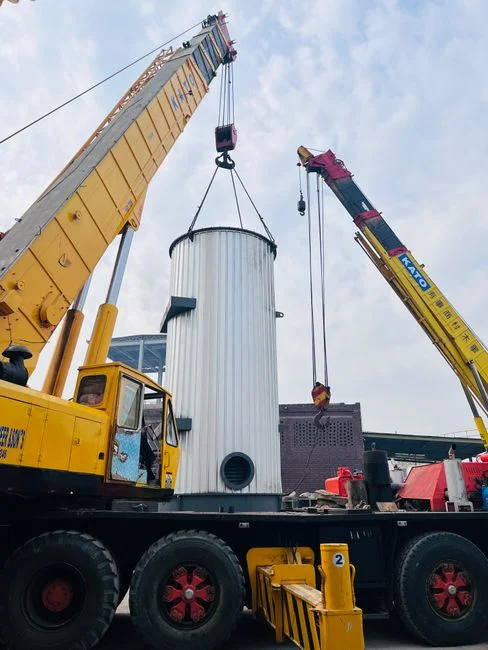
The 2026 standard train for automotive effluent runs in four stages, and the reuse target — not the flow rate — is what determines how many stages you build. A sewer-discharge plant stops at stage 2; a closed-loop reuse plant adds stage 3; a ZLD-mandated plant adds stage 4.
Step 1 — Pre-treatment. Rotary bar screens (2–6 mm aperture) capture rags and packaging film; a HydropureWater DAF system for oil & grease pre-treatment removes 90–95% of FOG and suspended solids; a HydropureWater automatic chemical dosing for pH and coagulant control handles pH adjustment (target 6.5–8.5) and coagulant addition. Hydraulic capacity here is the binding constraint on whole-plant throughput.
Step 2 — Primary biological. SBR (Sequencing Batch Reactor) and MBR (Membrane Bioreactor) are the two 2026 workhorses. The Springer 2024 SBR pilot hit 88.2% COD and 88.0% TP removal at the 422 mg/L / 6.7 mg/L baseline with no chemical dosing, confirming SBR as the lower-CAPEX option. MBR delivers <1 μm solid-free effluent suitable for direct RO feed, occupies roughly 40% of the SBR footprint, and consolidates clarification into the membrane tank — the trade-off is 30–50% higher CAPEX and membrane replacement every 5–8 years. For a closed-loop reuse plant, an MBR stage is typically specified; for a sewer-discharge plant, SBR is usually specified. A packaged HydropureWater MBR system for biological secondary treatment ships as a skid with control panel, blowers, and membrane cassettes pre-commissioned.
Step 3 — Tertiary polishing. Multimedia/sand filtration removes carryover TSS; a HydropureWater industrial RO for closed-loop reuse at 70% recovery polishes the MBR permeate to conductivity <50 µS/cm, suitable for rinse-water and boiler-feed return (YASA ET confirms RO permeate can return directly to the production line).
Step 4 — ZLD upgrade. RO concentrate (typically 15–25% of feed volume) is fed to an MVR (mechanical vapor recompression) evaporator, which compresses secondary vapor to recover latent heat and consumes 8–15 kWh/m³ of distillate — a 70% energy saving versus single-effect thermal evaporation (YASA ET). The evaporator distillate returns to the RO feed; the brine slurry goes to a crystallizer for salt recovery or solid disposal.
| End-Point Target | Process Train | Typical CAPEX Multiplier | Typical OPEX ($/m³) |
|---|---|---|---|
| Sewer discharge | DAF + SBR (or MBR) + chemical dosing | 1.0× baseline | 0.18–0.45 |
| Closed-loop reuse (≥70%) | DAF + MBR + RO | 1.6–2.0× | 0.60–1.00 |
| Zero liquid discharge | DAF + MBR + RO + MVR + crystallizer | 2.5–3.5× | 1.00–1.40 |
2026 CAPEX Breakdown by Plant Capacity
The $50,000–$5,000,000 LinkedIn 2025-09 headline range collapses into four defensible tiers once daily flow is fixed, and each tier maps onto a specific equipment list, building footprint, and reuse scope.
Tier 1 — ≤50 m³/day (small tier-2 parts supplier, single machining line). $50,000–$180,000. Packaged DAF + SBR skid, no reuse, sewer discharge, containerized or skid-mounted with a 20–40 m² footprint. Permitting and civil works are minor; installation typically completes in 8–12 weeks.
Tier 2 — 50–500 m³/day (tier-1 parts plant or small assembly line). $180,000–$900,000. DAF + SBR or MBR plus basic chemical dosing; optional RO skid for 30–50% reuse on rinse water. Building enclosure and HVAC for the membrane hall add 10–15% to the equipment price.
Tier 3 — 500–5,000 m³/day (full OEM assembly plant). $900,000–$3,200,000. DAF + MBR + RO polishing, full automation with online COD/TSS/pH sensors, building + civil works included. This is the dominant tier for greenfield EV battery-adjacent facilities in 2026, where ESG disclosures demand 60–80% reuse.
Tier 4 — >5,000 m³/day (large OEM with ZLD mandate). $3,200,000–$5,000,000+. Full train including MVR evaporator, crystallizer, and closed-loop reuse; reference design per YASA ET. Driven by discharge bans in water-stressed jurisdictions (north China, parts of India, southern EU) rather than water savings alone.
Regional cost variation is significant: China/SE-Asia equipment typically runs 30–45% below EU/US equivalent for the same spec, with the gap driven by lower fabrication labor rather than lower materials or quality (per standard B2B equipment benchmarks, 2025-Q4). Freight, duty, and on-site commissioning can close 30–50% of that gap for projects outside the manufacturing region.
| Tier | Flow (m³/day) | Typical Plant Profile | 2026 CAPEX (USD) | Reuse Scope |
|---|---|---|---|---|
| 1 | ≤50 | Small tier-2 parts supplier | 50,000–180,000 | None (sewer) |
| 2 | 50–500 | Tier-1 parts plant / small assembly | 180,000–900,000 | Optional 30–50% RO reuse |
| 3 | 500–5,000 | Full OEM assembly | 900,000–3,200,000 | 60–80% closed-loop |
| 4 | >5,000 | Large OEM with ZLD mandate | 3,200,000–5,000,000+ | ZLD, ≥95% reuse |
2026 OPEX Breakdown: What Each Cubic Meter Actually Costs
The 2026 OPEX band of $0.18–$1.40/m³ breaks into four cost drivers, and the relative weight of each shifts as you move from biological-only to ZLD. Modeling them separately — rather than as a single per-m³ figure — is what makes a budget defensible to procurement.
Energy — 40–55% of OPEX. Aeration dominates biological-stage energy at 0.3–0.6 kWh/m³ for SBR/MBR. When an MVR is present, evaporator energy jumps to 8–15 kWh/m³ of distillate produced, which is why MVR-equipped plants cluster at the top of the OPEX band. The 70% energy saving versus heat-pump evaporation (YASA ET) is real but absolute — it is still the largest line item in a ZLD plant.
Chemicals — 15–25% of OPEX. Coagulants (PAC, ferric chloride), flocculants (polyacrylamide), pH adjusters (lime, NaOH, H₂SO₄), defoamers, and cleaning chemicals for membranes. Typical dosing cost: $0.03–$0.12/m³ treated, scaling with influent TSS and FOG load.
Membranes and consumables — 10–20% of OPEX. MBR membrane replacement every 5–8 years ($40–80/m² of membrane area), RO membranes every 3–5 years ($15–30/m²), plus filter cloth, pump spares, UV lamps, and instrument calibration. Annualized replacement cost typically runs $0.04–$0.15/m³ across a typical mix.
Labor and monitoring — 10–15% of OPEX. A Tier 1/2 plant needs 1–2 operators per shift; a Tier 4 ZLD plant needs a dedicated process engineer plus 2–3 operators per shift. Full automation with online sensors (COD, TSS, pH, conductivity, NH₃-N) can compress this to <5% of OPEX on Tier 3/4 plants, but introduces a cyber/OT security line item. For MBBR-specific OPEX modeling, see the 2026 MBBR operating cost breakdown for a parallel methodology.
| OPEX Driver | Share of Total | Typical Unit Cost | Cost Lever |
|---|---|---|---|
| Energy (aeration + MVR) | 40–55% | $0.08–$0.55/m³ | Blower VFDs, MVR heat recovery |
| Chemicals (coag, pH, defoamer) | 15–25% | $0.03–$0.12/m³ | Dose optimization, on-site NaOH/OCl generation |
| Membranes & consumables | 10–20% | $0.04–$0.15/m³ | CIP protocol, pre-filtration |
| Labor & monitoring | 10–15% | $0.03–$0.18/m³ | Automation, online sensors |
ROI: When Reuse and ZLD Pay for Themselves
A worked payback calculation ties the OPEX and CAPEX figures to a number procurement will accept. The 52–83 m³/car water consumption benchmark (YASA ET) and a 100,000-vehicle/yr plant at the midpoint of 65 m³/car yield 6,500,000 m³/yr of process water demand.
At $1.50/m³ municipal water + $0.80/m³ sewer discharge, every cubic meter of treated effluent reused avoids $2.30 in combined water + discharge cost. RO reuse at 70% recovery on 3,000,000 m³/yr of biologically treated effluent therefore returns $4.8M/yr in avoided cost. Against ~$1.2M/yr incremental OPEX (membrane replacement + RO energy) and an amortized Tier 3 CAPEX of ~$1.5M/yr over 10 years, net annual savings run $2.1M/yr.
Payback math: RO reuse alone on a Tier 3 plant typically hits 2.5–4 years depending on local water tariffs. ZLD (MVR + crystallizer) usually extends to 5–7 years and is rarely justified on water savings alone — the driver is compliance with a discharge ban or a binding ESG target. The Springer 2024 SBR pilot specifically concluded that the process can "reduce operating costs for enterprises" by removing COD and TP without chemical dosing, which parallel-checks as OPEX optimization on the biological stage rather than the reuse stage. For sites with zinc-bearing phosphating wastewater, reuse economics improve further when discharge compliance underpins the project — see the 2026 zinc discharge limit compliance guide for current regulatory thresholds.
Frequently Asked Questions
What is a defensible 2026 cost-per-vehicle benchmark for automotive wastewater treatment? At 52–83 m³/car water consumption and a Tier 3 reuse OPEX of $0.60–$1.00/m³, treatment cost runs $31–$83 per vehicle produced for the water-treatment line item, before any capital amortization.
What is the standard treatment train for a paint shop? DAF for overspray and FOG → SBR or MBR for COD/BOD reduction → RO for closed-loop reuse. Solvent-bearing streams typically route through an activated carbon pre-filter before the RO stage.
Is zero liquid discharge mandatory in 2026? Not universally — ZLD is binding in specific jurisdictions (parts of north China, southern EU, select Indian states) but voluntary elsewhere. It pays back on water savings only at water tariffs above ~$2.50/m³ or where discharge is prohibited.
MBR vs. SBR — which is more cost-effective? SBR delivers 88.2% COD removal at lower CAPEX (Springer 2024) and is the right choice for sewer discharge. MBR costs 30–50% more upfront but occupies ~40% less footprint and produces RO-ready permeate, making it the right choice whenever reuse is the endpoint.
How do I estimate OPEX from influent load? Rule of thumb: for every 100 mg/L of influent COD above 200 mg/L, add $0.04–$0.06/m³ to biological-stage OPEX. Heavy-metal-bearing streams (phosphating) add another $0.08–$0.15/m³ for chemical precipitation and sludge handling.