What Is the Zinc Discharge Limit for Industry in 2026?
The zinc discharge limit for industry in 2026 ranges from 0.3 mg/L to 5.0 mg/L by jurisdiction and sector. China GB sets 2.0 mg/L for most direct-discharge industries. US EPA 40 CFR 433 caps total zinc at 2.61 mg/L daily maximum and 1.48 mg/L monthly average. The EU IED BAT-AEL range is 0.3–2 mg/L.
When regulations quote a zinc number, they almost always mean total zinc. That is the acid-digestible fraction after strong-acid preservation (US EPA Method 200.2 or ISO 11885). Dissolved zinc is the 0.45 µm-filtered fraction, and Zn²⁺ is the ionic species that drives the chemistry. The gap matters. A clarifier overflow reading 1.8 mg/L total zinc may carry only 0.4 mg/L dissolved. That decides whether a downstream ion-exchange polish is needed. Always confirm with the permit whether the limit applies to total or dissolved before specifying a treatment train.
The 2026 range of 0.3–5.0 mg/L reflects a toxicity-driven floor. The 96-hour LC50 for Daphnia magna sits around 0.07 mg/L Zn²⁺. Chronic effects on fish reproduction appear below 0.1 mg/L in soft water. Those values push regulators to treat zinc as a priority pollutant despite lower acute mammalian toxicity. The LiqTech reference figure of 2 mg/L "not to exceed at outlet" remains a useful working ceiling. Most direct-discharge permits in 2026 cluster at 1–2 mg/L. Surface-water protected zones drop to 0.5 mg/L under the China GB 3838 framework.
Zinc Limits by Country and Region: 2026 Compliance Table
No single 2026 number covers every plant. The table below maps the major regulatory frameworks an EHS engineer will encounter. The binding limit is set by the receiving environment: direct discharge, indirect municipal sewer, or zero-liquid-discharge reuse. The sector-specific categorical standard then applies.
| Region | Standard Reference | Sector | Daily Max (mg/L) | Monthly Avg (mg/L) | Direct / Indirect |
|---|---|---|---|---|---|
| China | GB 8978 Class 1 / GB 31573 | Most industries, direct discharge | 2.0 | — | Direct |
| China | GB 8978 Class 2 / GB/T 31962 | Indirect to municipal sewer | 5.0 | — | Indirect |
| China | GB 3838 surface water (protected zones) | Drinking-water source protection | 0.5–1.0 | — | Direct (sensitive) |
| China | Integrated wastewater (other industries tier) | Light industry, non-ferrous | 5.0 | — | Direct (tier 2) |
| USA | 40 CFR 433.15 / 433.17 (Metal Finishing) | Electroplating, printed circuit boards | 2.61 (earlier cites 4.0) | 1.48 (earlier cites 2.61) | Indirect (POTW) |
| USA | JEA (Jacksonville, FL) local limit | Industrial contributory users | 2.61 | 2.61 | Indirect (POTW) |
| EU | IED 2010/75/EU BAT-AEL (Non-Ferrous Metals) | Non-ferrous primary and processing | 0.3–2.0 | — | Direct (varies) |
| EU | CWW BREF (Common Wastewater) | Combustion and multi-sector plants | up to 5.0 | — | Direct (BREF range) |
| WHO | Drinking Water Guidelines (4th ed.) | Tap-water target for effluent reuse | 3.0 | — | Reuse benchmark |
Earlier secondary citations often listed 40 CFR 433.17 zinc as 4.0 mg/L daily maximum and 2.61 mg/L monthly average. According to the current eCFR text of 40 CFR 433.15 (PSES) and 433.17 (PSNS), Zinc (T) is 2.61 mg/L maximum for any 1 day. The monthly average is 1.48 mg/L for metal-finishing pretreatment (US EPA eCFR, retrieved 2026). Keep the older 4.0 / 2.61 pair only as historical background when reading older local-limit tables. Categorical pretreatment standards remain the federal ceiling. POTWs can adopt stricter local limits but cannot loosen the federal cap without an approved Removal Credit. The JEA contributory-user table still shows 2.61 mg/L daily and monthly in many published local-limit sheets. Treat that as a local adoption of the federal daily ceiling, not a monthly average from §433.17.
The EU BAT-AEL lower bound of 0.3 mg/L is binding mainly when the receiving water is designated for drinking-water abstraction. Otherwise, most plants we size for non-ferrous finishing design to the 1–2 mg/L mid-range to keep operational margin. The 5 mg/L BREF-style upper bound is a worst-case ceiling, rarely the design target. According to WHO Guidelines for drinking-water quality (4th ed. chemical fact sheet), no formal health-based guideline value is set for zinc. Drinking-water containing zinc above 3 mg/L may not be acceptable to consumers. The 3.0 mg/L reuse benchmark in the table remains an acceptability target, not a toxicity limit (WHO, 2022 fact sheet).
What is CPCB's zinc wastewater discharge limit?
CPCB industrial effluent schedules set zinc limits by industry class rather than one nationwide number. Plants operating in or exporting equipment to India should confirm the applicable CPCB schedule for zinc before locking a design residual. Until that schedule is verified, trains sized for the 1–2 mg/L envelope used under China GB Class 1 and EU BAT mid-range usually cover typical CPCB zinc expectations. Do not assume the US 2.61 / 1.48 mg/L pair applies in India without checking the current CPCB notification for that sector.
What are CPCB cadmium and nickel discharge limits?
CPCB cadmium and nickel limits sit in industry-specific schedules. Read them from the current notification; do not infer them from zinc. For comparison, US EPA metal-finishing pretreatment under 40 CFR 433.15 / 433.17 sets Cadmium (T) at 0.69 / 0.26 mg/L under PSES (daily / monthly), or 0.11 / 0.07 mg/L under PSNS. Nickel (T) is 3.98 / 2.38 mg/L for both PSES and PSNS (US EPA eCFR, 2026). Battery and plating plants that co-discharge Zn with Ni or Cd often find the mixture toxicity unit — not zinc alone — sets the binding residual.
Which Industries Are Tightest? Sector-Specific Zinc Limits
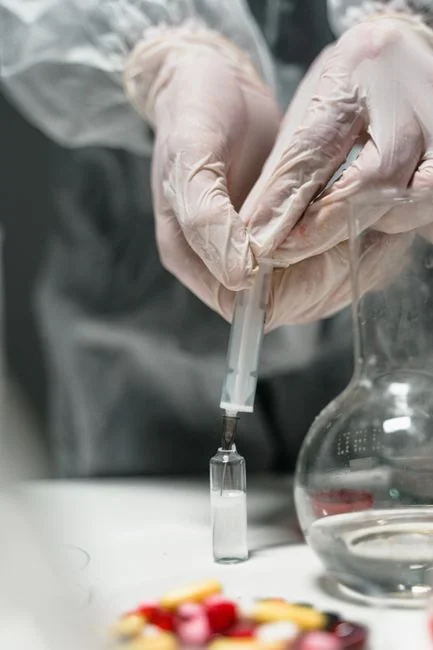
The tighter the receiving-water quality objective, the tighter the treatment train. Sector matters because influent zinc and co-contaminant chemistry vary by an order of magnitude across the industries below.
| Sector | Typical Influent Zn (mg/L) | 2026 Compliance Target (mg/L) | Applicable Standard | Key Driver |
|---|---|---|---|---|
| Hot-dip galvanizing | 50–500 | 1.0–2.0 | GB 8978 / 40 CFR 433 / BAT-AEL | ZnCl₂/NH₄Cl flux carryover; chloride co-loading |
| Electroplating and PCB | 20–200 | 2.61 (monthly avg); eCFR 2.61 daily / 1.48 monthly | 40 CFR 433.15 / 433.17 | Cyanide-zinc bath dual compliance |
| Mining and mineral processing | 10–200 | 1.0–5.0 | IED BAT-AEL / local receiving-stream | Receiving water hardness; metal mixture toxicity |
| Battery manufacturing (Ni-Zn, alkaline) | 5–50 | 0.5–2.0 | BAT-AEL lower bound / local | Co-contaminants Ni, Cd driving combined toxicity |
| Steel and iron pickling | 5–50 | 5.0–20 | Indirect to POTW (local) | Acid-pickling rinse; reuse offsets discharge |
Hot-dip galvanizing is the binding case. The flux chemistry — typically ZnCl₂ + NH₄Cl at 350–450 °C — drags 50–500 mg/L zinc into the rinse water. Most galvanizers must reach ≤1 mg/L to satisfy the EU BAT-AEL lower bound or a strict POTW pretreatment program. Battery plants face a different pressure. Co-discharge of nickel and cadmium at sub-mg/L levels drives the Receiving Water Combined Toxicity Unit. That forces the zinc target to 0.5–1 mg/L to keep the mixture below 1.0 TU. Pickling lines are the loosest case, typically 5–20 mg/L. The acid load dominates the permit negotiation, and zinc is rarely the binding parameter.
How to Remove Zinc from Industrial Wastewater to Meet the Limit
The unit-operation decision is driven by the target number, not the influent. A plant that must hit 2 mg/L direct-discharge rarely needs ion exchange. A plant that must hit 0.3 mg/L for water reuse cannot rely on precipitation alone. The five steps below are sequenced by decreasing residual — pick the deepest step that closes the gap, then stop.
- Hydroxide precipitation at pH 9–10. The reaction Zn²⁺ + 2OH⁻ → Zn(OH)₂ has a solubility minimum near pH 9.5. Residual dissolved zinc drops to 0.5–2 mg/L at 25 °C. Sodium hydroxide (NaOH) gives tighter pH control and lower sludge volume. Lime (Ca(OH)₂) cuts chemical cost by 40–60% but doubles sludge mass. Expect 2.5–4 kg dry solids per kg Zn removed, dominated by co-precipitated iron and calcium salts. PLC-controlled pH and coagulant dosing is the biggest lever for holding residual stable across influent swings.
- Sulfide precipitation for sub-1 mg/L targets. ZnS has a solubility product roughly six orders of magnitude lower than Zn(OH)₂. Controlled dosing of Na₂S or ferrous sulfide (FeS) at pH 7–9 drives residual to 0.05–0.5 mg/L. The catch is sulfide carryover. Residual S²⁻ above 0.5 mg/L violates most permits and creates H₂S risk in acidic streams. Use a sulfide probe and overdose no more than 5–10% above stoichiometric demand.
- DAF clarification for hydroxide sludge. When influent TSS exceeds 200 mg/L or fats/oils are present (galvanizing quench tanks are common), a DAF system for precipitated zinc sludge outperforms a lamella. Typical TSS removal is 90–95% versus 70–85% for gravity settling, with a smaller footprint.
- Ion-exchange polishing for sub-0.1 mg/L. Cationic resin in sodium form (strong-acid, gel-type) loads Zn²⁺ to 1.2–1.5 eq/L capacity. Once feed is below 10 mg/L after precipitation, removal reaches 95–99% to under 0.1 mg/L. Regeneration uses 4–6% HCl followed by 2–4% NaOH. The regenerant brine loops back to the precipitation reactor. This closes the metal mass balance and avoids a liquid waste stream. Comparable copper and zinc polishing data appear in the field reference on ion exchange for sub-mg/L metal polishing.
- Membrane polish (UF + RO) for water reuse. Reverse osmosis achieves 99%+ rejection of Zn²⁺. It concentrates the residual into 15–25% of the feed volume. The concentrate returns to the precipitation reactor. The permeate meets the WHO 3 mg/L acceptability benchmark for reuse. Plan concentrate disposal at 5–15% of feed flow, and verify that scaling indices (especially BaSO₄ and CaCO₃) stay below 1.0 on the concentrate side.
The decision boundaries are the 2 mg/L LiqTech ceiling and the 5 mg/L BREF upper bound. If the target is 2 mg/L direct discharge, precipitation + DAF is sufficient. If the target is sub-1 mg/L, add ion exchange. If the target is sub-0.1 mg/L or the plant is targeting water reuse, add RO. A common error is specifying ion exchange on un-precipitated feed above 50 mg/L. The resin exhausts in hours, not days, and the OPEX collapses.
Is there a pH limit on industrial water discharge?
Most direct-discharge and POTW permits include a pH window, commonly 6.0–9.0. That window is separate from the zinc concentration limit. Zinc hydroxide precipitation needs pH 9–10 at the reactor. The train must neutralize the clarified effluent back into the permit window before the outfall. Plants that skip final pH trim often pass zinc and fail the pH clause on the same sample day. Size the acid trim tank for the full NaOH or lime dose used upstream, not for average alkalinity alone.
CAPEX and OPEX Reality Check: Cost to Hit the 2026 Zinc Limit
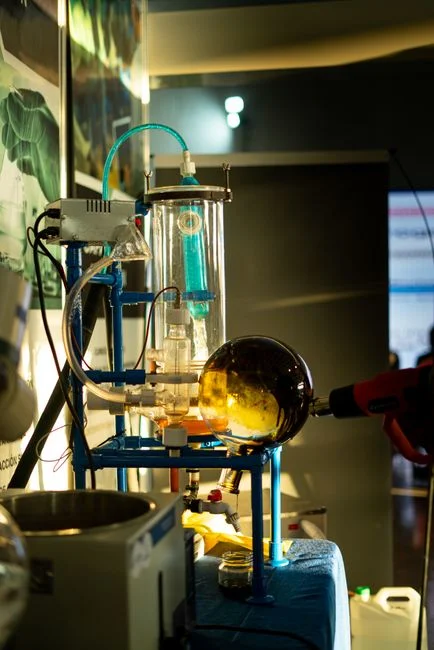
Engineers typically face a 10–50 m³/h flow range, so the table below brackets that envelope. Numbers reflect a greenfield install in a low-cost region; expect +30–60% for a plant-room retrofit in a Tier 1 city.
| Treatment Train | CAPEX (10–50 m³/h) | OPEX ($/m³) | OPEX Drivers | Residual Zn Achieved | Water Recovery |
|---|---|---|---|---|---|
| Precipitation + Lamella | $50K–$150K | $0.20–$0.35 | NaOH 60%, sludge 30%, labor 10% | 1–2 mg/L | None |
| Precipitation + DAF | $80K–$250K | $0.25–$0.40 | NaOH 55%, polymer 15%, sludge 25% | 1–2 mg/L | None |
| Precipitation + Ion Exchange | $180K–$900K | $0.80–$1.50 | Resin regeneration 50%, NaOH 25%, sludge 15% | <0.1 mg/L | 90–95% |
| Precipitation + UF + RO | $500K–$2.5M | $0.60–$1.20 | Membrane replacement 40%, energy 30%, NaOH 20% | <0.05 mg/L | 80–90% |
The hidden line item is sludge. At 2.5–4 kg dry solids per kg Zn removed and $1–2/kg disposal cost (HydropureWater field data, 2026), sludge hauling adds up fast. A 20 m³/h plant removing 50 mg/L zinc spends $60K–$95K per year on hauling alone. In the US, Zn-rich sludge typically fails TCLP for zinc and classifies as hazardous under RCRA. In the EU it falls under EWC 11 02 02. A high-rate lamella clarifier for hydroxide sludge thickens the underflow to 3–5% DS before the press. That step can halve the hauling cost. For a more detailed model, see the 2026 TCO breakdown for wastewater plants. It applies a five-year cost stack to the same flow envelope.
Compare the 100/150/500 mg/L "other industries" tier against the 2 mg/L direct-discharge ceiling. A plant discharging 100 m³/h of 200 mg/L zinc faces 100× the removal load of a plant at 2 mg/L. The OPEX penalty compounds. Tightening the upstream process (better rinsing, counterflow cascades) almost always beats adding a downstream unit operation.
Selection Checklist and Next Step
Use this short checklist before locking the train:
- Confirm total vs dissolved zinc on the permit face sheet.
- Map the binding number: China 2.0 mg/L, US 2.61 / 1.48 mg/L under 40 CFR 433, EU 0.3–2 mg/L BAT-AEL, or a local POTW limit.
- Measure influent Zn, TSS, cyanide, and co-metals (Ni, Cd) on a composite sample.
- Choose the shallowest train that hits residual: precipitation + clarifier/DAF for ~2 mg/L; add sulfide or ion exchange for sub-1 mg/L; add RO only for reuse or sub-0.1 mg/L.
- Budget sludge as a first-class OPEX line, not an afterthought.
- Include final pH trim so the outfall stays inside the permit pH window.
- Verify CPCB or other export-market schedules if the plant or buyer is outside China/US/EU.
Who this is for: EHS and process engineers at galvanizing, plating, PCB, battery, and mining sites. They need to document a zinc residual against a named standard. Who should look elsewhere: plants whose binding pollutant is chromium hexavalent or cyanide alone, with zinc already below 0.5 mg/L. Start with the cyanide or Cr(VI) train instead. For a sized train and sludge mass balance against your permit, send flow, influent Zn, and limit text through our request a zinc-compliance quote form.
Frequently Asked Questions
What is the zinc discharge limit for industry in China in 2026?
The direct-discharge limit is 2.0 mg/L total zinc under GB 8978 Class 1 and GB 31573 for inorganic chemical industries. Indirect discharge to a municipal sewer is 5.0 mg/L under GB/T 31962. Surface-water protected zones under GB 3838 drop to 0.5–1.0 mg/L. Always match the Class or sector standard named on the local permit, not a generic handbook table.
How do I reduce zinc in wastewater to below 1 mg/L?
Run hydroxide precipitation to pH 9.5 with NaOH, then polish with either sulfide precipitation (Na₂S, to 0.05–0.5 mg/L) or cationic ion exchange in sodium form (to under 0.1 mg/L). DAF or lamella clarification ahead of the polish step prevents solids breakthrough. Most plants we size for sub-1 mg/L targets run precipitation first and only then add the polish step.
Is zinc regulated under US EPA categorical pretreatment?
Yes. Current eCFR text for 40 CFR 433.15 and 433.17 caps Zinc (T) at 2.61 mg/L daily maximum and 1.48 mg/L monthly average for metal finishing. Earlier secondary tables often quoted 4.0 / 2.61 mg/L; keep those figures only as background. Local POTWs such as JEA may adopt the federal daily ceiling and may impose stricter mass-based limits if the SIU contribution is significant.
What is the cheapest way to meet a 2 mg/L zinc limit?
pH adjustment with NaOH or lime to pH 9–10, followed by a lamella clarifier or DAF for solids capture, is usually enough for a 2 mg/L residual. CAPEX typically stays under $200K for a 20 m³/h flow; OPEX around $0.25–$0.40/m³ is dominated by NaOH consumption and sludge disposal. Adding ion exchange before the residual requires it wastes resin capacity and raises OPEX without changing the permit outcome.
How is total zinc measured for compliance?
Preserve the sample to pH < 2 with HNO₃, digest with hot strong acid, then analyze by ICP-OES (US EPA Method 200.2) or flame atomic absorption (Method 289.1). ISO 11885 (ICP-OES) and ISO 8288 (flame AAS) are the equivalent international methods. Report in mg/L total zinc, not Zn²⁺, unless the permit explicitly names dissolved zinc.