Circular Water Economy Industrial WWTP Capex 2026: What the Numbers Mean
Circular water economy industrial WWTP capex in 2026 runs $80–$250 per m³ for DAF pretreatment, $150–$600 for MBR, $400–$1,200 for RO reuse, and $1,500–$4,000 for full ZLD, inside a water-systems market worth $535.9M in 2025, growing at 4.2% toward $806.3M by 2035.
Circular economy market size for water systems stood at $535.9M in 2025 and is forecast to reach $806.3M by 2035 at a 4.2% CAGR (2026–2035) per Global Insight Services. The slice covers reuse integration, reclaimed-water distribution, resource recovery, and the digital layer that links them. It is a regulated subset of total water spend, not the full WWTP market.
That same frame excludes most secondary-treatment hardware. Global Insight Services' definition stops at reuse systems, reclaimed water distribution, resource recovery (sludge-to-biosolids, brine-to-salts), and the controlling digital layer. Buyers comparing this figure to full plant bids must add membranes, concentrate handling, and dewatering that sit outside the headline.
For context, the broader circular economy market reached $166.95B in 2025 and is projected at $491.35B by 2035 at 11.4% CAGR (per a parallel tracker, with a second source citing 23.5% CAGR over the same window). The water-specific segment represents roughly 0.3% of that larger market by dollar value. That gap explains why the 4.2% growth rate looks modest next to the wider circular-economy narrative.
The policy floor under both curves is the EU Circular Material Use Rate (CMUR), which hit 11.8% in 2023 against a 2030 target of more than 23% and currently sustains over 4.3 million jobs across member states. The European Environment Agency now reports secondary materials at 12.2% of total material use in 2024 and notes the 2030 ambition was confirmed and slightly increased to 24% in the Clean Industrial Deal. Roughly 11 percentage points of material use must still move through reuse, recovery, and recycling infrastructure by 2030. For an industrial buyer, the water market is the regulated bottleneck through which larger circular-economy spending must flow. Policy and tech detail for the same horizon sits in our Circular Water Economy 2026 Outlook: Tech, Policy & B2B Equipment guide.
Why a 4.2% CAGR Understates the Industrial Opportunity
Equipment-level demand for MBR modules, RO skids, DAF units, and ZLD evaporators tracks closer to the 11.4% segment growth because tightening discharge limits force tertiary treatment and reuse loops. Those stages were largely absent in most Chinese industrial parks before 2020. Most plants we size for reuse retrofit still run secondary trains first and add membrane polishing only when the permit tightens.
Three regulatory vectors are driving this demand. China's GB 8978-1996 and the newer GB discharge standard series continue to tighten COD, ammonia, and total dissolved solids (TDS) limits, particularly for industries discharging into sensitive receiving waters. The EU Urban Waste Water Directive 91/271/EEC was updated in 2024 to mandate quaternary treatment and reuse targets for plants above 100,000 PE.
The European Commission confirms the revised directive entered into force on 1 January 2025, with quaternary treatment financed through extended producer responsibility. The same text directs treatment plants to become energy-neutral and cut greenhouse-gas emissions by 2045, and to advance circularity through water reuse and resource recovery. US EPA categorical effluent guidelines are being enforced more aggressively under the 2024–2026 consent-decree cycle, with PFAS and TDS limits dropping the most. EPA describes effluent guidelines as national wastewater discharge standards developed on an industry-by-industry basis, so each tightened limit lands as plant-level hardware. Each force drives a refresh at the back end of the treatment train — exactly where MBR, RO, DAF, and ZLD equipment operate.
The Global Insight Services definition of circular water economy systems includes water reuse, reclaimed water distribution, and resource recovery — not just treatment. The addressable industrial spend is several times the $535.9M headline once you count membrane replacements, RO concentrate handling, and biosolids dewatering that follow each reuse installation. A 4.2% system CAGR with an 11–23% end-market tailwind mirrors early industrial software, where growth is slower at the wrapper but faster where capex actually lands. For growth-rate math versus this size frame, see the circular water economy growth rate 2026 breakdown.
China Industrial WWTP Reuse Retrofit Capex 2026: The 24–36 Month Pull-Forward
China industrial WWTP reuse retrofit capex 2026 spending is pulled forward 24–36 months ahead of original plant design lives by provincial GB Class 1A enforcement and stricter local standards in Tianjin, Beijing, and Guangdong. Europe's CMUR gap and the 2024 UWWTD update keep funding on reuse infrastructure in Germany, the Netherlands, and Spain. The retrofit window is therefore the budget window.
What 2026 Circular Water News Should Buyers Track?
Buyers should track permit tightening, reuse mandates, and regional enforcement calendars before chasing headline market totals. China's provincial GB Class 1A and stricter local standards are pulling reuse capex forward. Europe's CMUR gap and the revised UWWTD keep funding flowing to reuse infrastructure in Germany, the Netherlands, and Spain.
In North America, semiconductor fab buildouts in the US Southwest and Canadian oil-sands produced-water treatment set absolute dollar demand. Vendor and regulator roundups that sit beside these capex numbers are covered in water treatment circular economy news 2026 coverage.
Regional Breakdown: Where the 2026 Spend Actually Goes
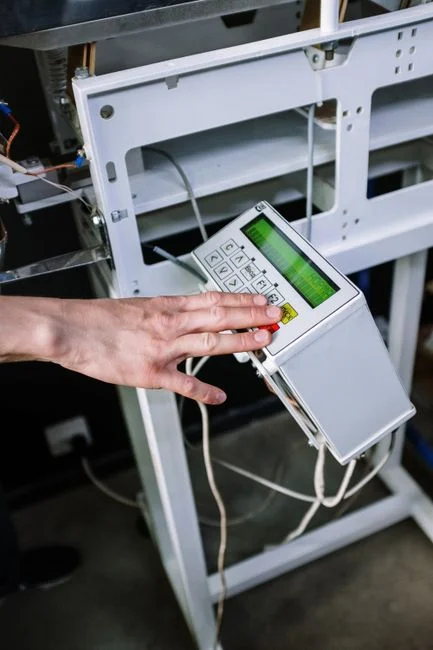
Circular Water Economy Regional Capex Breakdown 2026
Circular water economy regional capex breakdown 2026 planning starts with Asia-Pacific, the fastest-growing region at 5.0% CAGR on a $189.7M 2025 base, with China the dominant node because industrial discharge accounts for the largest share of the country's total wastewater volume. North America leads absolute dollars across the broader circular economy, but the water-specific segment there is increasingly driven by semiconductor and produced-water reuse. Europe remains policy-driven. Country-by-country policy and tech notes are in the circular water economy regional analysis 2026.
| Region | 2025 Base (USD) | 2035 Forecast (USD) | CAGR (2026–2035) | Primary Demand Driver |
|---|---|---|---|---|
| North America | $148.2M | $214.6M | 3.8% | Semiconductor & produced-water reuse |
| Europe | $126.4M | $182.1M | 3.7% | EU CMUR & UWWTD mandates |
| Asia-Pacific | $189.7M | $308.4M | 5.0% | China industrial GB enforcement |
| Rest of World | $71.6M | $101.2M | 3.5% | GCC & Mexico industrial corridors |
Asia-Pacific is the primary segment for 2026 capex planning for Chinese industrial sites and EPC contractors. The 5.0% regional CAGR exceeds the 4.2% global headline. Equipment-level demand within the region is accelerating as tertiary and reuse stages are retrofitted onto plants originally designed for secondary treatment.
Industrial Wastewater Reuse Capex Bands 2026: Per-m³ Benchmarks
Industrial wastewater reuse capex bands 2026 for a Chinese-industrial EPC budget request use per-m³ installed costs. MBR systems (10–2,000 m³/day) land at $150–$600/m³. RO reuse loops run $400–$1,200/m³, and DAF pretreatment runs $80–$250/m³. Full ZLD with thermal or brine concentrator stages sits at $1,500–$4,000/m³. These bands cover civil, mechanical, membranes, instrumentation, and commissioning, but exclude land and buildings.
Site-level math shows how the bands become project budgets. A single 1,000 m³/day MBR installation at the $300/m³ mid-band equals $300,000 in capex. Given the thousands of Chinese industrial sites still discharging to municipal sewers or restricted waters, the $535.9M aggregate aligns with these per-site economics. A 500 m³/day MBR at $350/m³ lands at $175,000, while a 200 m³/day DAF pretreatment skid at $150/m³ costs $30,000 — a figure that often fits inside annual maintenance capex envelopes.
| Process Train | Flow Range (m³/day) | 2026 USD per m³ Installed | Typical Application |
|---|---|---|---|
| MBR (membrane bioreactor) | 10–2,000 | $150–$600 | Municipal & industrial secondary/tertiary, reuse polishing |
| Industrial RO (reuse loop) | 50–5,000 | $400–$1,200 | Semiconductor, pharma, boiler feed, closed-loop cooling |
| DAF (dissolved air flotation) | 20–3,000 | $80–$250 | High-FOG, high-TSS pretreatment (food, paper, petrochem) |
| Full ZLD (with brine concentrator) | 100–2,000 | $1,500–$4,000 | Coal-chemical, lithium battery, zero-discharge mandates |
Product fit against these bands is direct. An integrated MBR system anchors the $150–$600/m³ band, with the DF series flat sheet membrane modules as the replaceable core.
A DAF system covers the $80–$250/m³ pretreatment band, while an industrial RO system sits in the $400–$1,200/m³ band for downstream polishing.
Compact sites that need a buried secondary package before tertiary reuse often start with an Underground Package Sewage Treatment Plant (WSZ Series). These costs indicate that the average new Chinese industrial WWTP in 2026 will spend 5–8% more than its 2025 equivalent, specifically within tertiary and reuse stages.
Which Equipment Categories Capture the Share as Reuse Tightens
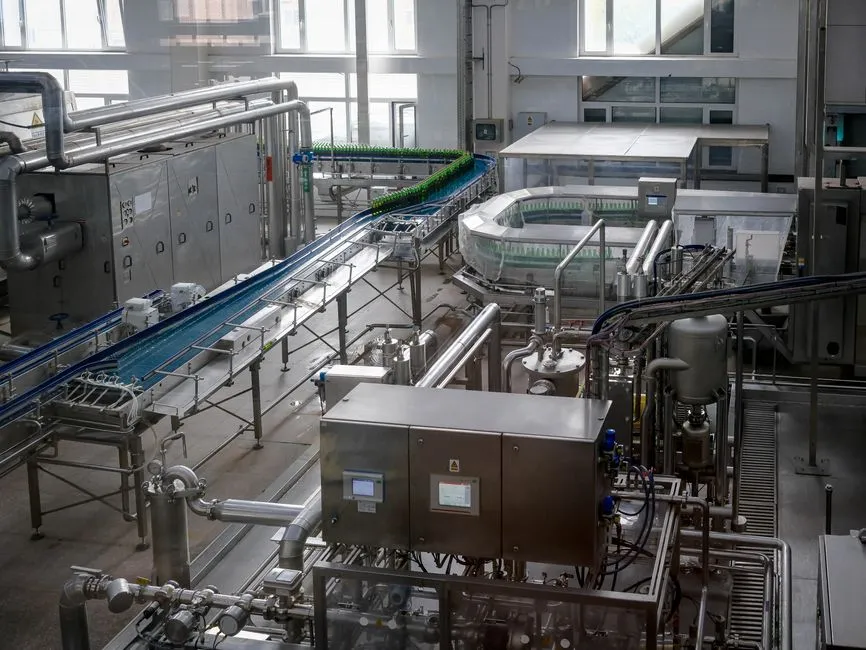
MBR technology is the primary driver of the reuse transition and is expected to track above the 4.2% global CAGR. Every Chinese industrial park retrofit adding a reuse loop incorporates MBR capacity to replace conventional activated sludge systems. Industrial RO demand is highest in semiconductor, pharma, and power generation reuse loops, where recovery rates up to 95% and high-rejection specifications are mandatory. DAF systems continue to grow as a pretreatment standard for high-FOG and high-TSS effluents, protecting downstream membrane trains from fouling.
ZLD and brine recovery represent the highest capex intensity, particularly for Chinese coal-chemical and lithium-battery clients facing stricter TDS limits in 2026. A high-efficiency sedimentation tank often precedes DAF for primary clarification, and a plate-frame filter press handles biosolids dewatering.
Market intelligence regarding desalination market drivers for 2026 influences RO demand, while the decentralized wastewater treatment growth rate in 2026 is concentrated in the 10–2,000 m³/day range.
Digital integration, including digital twin costs and smart water metering, is increasingly embedded into these reuse-loop accounting layers.
What Is the PFAS Wastewater Treatment Market Size?
No separate PFAS treatment market total is published here; PFAS shows up as a permit driver inside the same circular water spend. US EPA categorical effluent guidelines under the 2024–2026 consent-decree cycle are pushing PFAS and TDS limits lower, which forces polishing and concentrate-handling hardware on industrial trains. Budget that work inside the RO ($400–$1,200/m³) and ZLD ($1,500–$4,000/m³) bands rather than as a standalone market line. Plants facing PFAS limits usually add adsorption, high-rejection RO, or thermal concentration after the core biological stage.
How to Use This Data for a 2026 Capex Decision
A 2026 capex decision needs three inputs: the governing discharge standard, an influent-to-train map, and the per-m³ band applied to design flow. Step 1: Identify the discharge standard the site must meet — China GB Class 1A, EU UWWTD, or US EPA categorical — to set the minimum process train. Step 2: Map influent to treatment train: high TSS/FOG requires DAF; high organics require MBR; high TDS requires RO; and zero-discharge mandates require ZLD.
Step 3: Apply the capex band table to the design flow, adding a 15–25% contingency for 2026 pricing volatility in steel, membrane modules, and automation. A 1,000 m³/day MBR-RO reuse loop at $500/m³ blended enters a budget at $500,000 plus contingency, providing a defensible line item for procurement directors. That is how circular water economy industrial WWTP capex 2026 budgeting works in practice: fix the standard, map the train, apply the band.
Selection checklist for a 2026 reuse bid:
- Confirm the governing discharge or reuse standard and TDS/PFAS clauses.
- Measure peak and average flow (m³/day) before locking equipment size.
- Match FOG/TSS to DAF, organics to MBR, dissolved salts to RO or ZLD.
- Price installed cost from the 2026 USD/m³ bands, not brochure list prices.
- Add 15–25% contingency for membranes, steel, and automation volatility.
- Plan membrane replacement and brine or biosolids handling in year-1 opex.
- Align regional enforcement timing (China GB, EU UWWTD, US EPA) with the bid year.
Who This Is For / Next Step
Plant engineers, EPC estimators, and procurement managers sizing industrial reuse or ZLD packages for 2026–2027 budgets are the intended readers. Commodity municipal secondary-only projects with no reuse or TDS driver should look elsewhere. If you already have flow, influent, and the target standard, send them through our request a reuse or ZLD equipment quote form for a train-level budget check.
Frequently Asked Questions
What is the 2026 circular water economy market size?
The water-specific systems market was $535.9M in 2025 with a 4.2% CAGR projected to $806.3M by 2035. The broader circular economy market is roughly 300× larger at $166.95B in 2025, growing at 11.4% to 23.5% annually. Buyers should treat the $535.9M figure as the regulated reuse-and-recovery slice, not total WWTP spend.
Which region is growing fastest for circular water systems?
Asia-Pacific leads with a 5.0% regional CAGR versus the 4.2% global headline. Chinese industrial GB discharge enforcement and reuse retrofits are the main pull. North America still leads absolute dollars in the wider circular economy, but water-specific growth there is tied to semiconductor and produced-water projects.
How much does an industrial water reuse plant cost per m³ in 2026?
Based on the capex-band table, MBR costs $150–$600/m³, industrial RO $400–$1,200/m³, DAF $80–$250/m³, and full ZLD $1,500–$4,000/m³ installed. Bands cover civil, mechanical, membranes, instrumentation, and commissioning, but exclude land and buildings. Add 15–25% contingency for 2026 steel and membrane volatility.
Does a 4.2% CAGR mean industrial equipment demand is slow?
No. System-level circular water packages grow at 4.2%, while equipment demand for MBR, RO, DAF, and ZLD tracks closer to the 11.4% broader segment growth. Permit-driven tertiary and reuse retrofits create that gap. Capex lands at the unit process, not only at the integrated-system wrapper.
How should a plant convert market size into a site budget?
Pick the governing standard, map influent to DAF/MBR/RO/ZLD, then multiply design flow by the matching 2026 USD/m³ band. A 1,000 m³/day MBR-RO reuse loop at $500/m³ blended is about $500,000 before contingency. Use regional CAGR only to time the bid, not to set unit prices.
When did the revised EU Urban Waste Water Treatment Directive take effect?
The revised directive entered into force on 1 January 2025, per the European Commission's urban wastewater page. It mandates quaternary micropollutant removal financed through extended producer responsibility and directs plants toward energy-neutral operation by 2045. Plants above 100,000 PE are the first compliance tier under the 2024 update.