Why Energy Management Is Now Core to Water Treatment Plant Operations
Energy typically represents 30-40% of total operating cost at a municipal or industrial water treatment plant, and on a 50,000 m³/day facility the electricity line alone runs $1.5-3M/year at 2026 tariff levels (per IWA and USEPA energy-use benchmarks). Inside that bill, the load profile is highly concentrated: aeration 50-60%, pumping 15-25%, sludge handling 10-15%, and lighting/buildings 5-10%. The implication is direct — the blower room and the pump gallery, not the headworks, are where a defensible energy project is funded.
Three pressures are forcing EMS adoption in 2026. First, electricity price volatility: industrial tariffs in the EU and China have moved in 10-30% step changes over the last 18 months, and spot-price exposure on demand-response programs makes real-time load shifting a revenue line, not a buzzword. Second, Scope 2 emissions reporting under CSRD (EU) and ISSB frameworks now requires auditable kWh data per cubic meter treated, which the typical SCADA does not produce. Third, tightening effluent energy-intensity KPIs in EU UWWTD permits and in Chinese provincial discharge rules mean the EMS is becoming a permit-compliance artifact.
The pain-point scenario repeats at hundreds of plants: a 50,000 m³/day WWTP runs its aeration blowers at fixed speed 24/7, dissolved oxygen swings 1-4 mg/L through the day, and operators have no visibility into specific energy (kWh/kg BOD removed). The blower electricity is being spent twice — once to deliver oxygen, and once to over-aerate and waste it. That is the opportunity hiding in plain sight, and it is the business case for the water treatment plant energy management system described in the rest of this guide.
Anatomy of a Water Treatment Plant Energy Management System
A WTP EMS is a four-layer stack. Each layer has a specific function, specific hardware, and specific data outputs, and the value of the system is lost if any one of them is skipped.
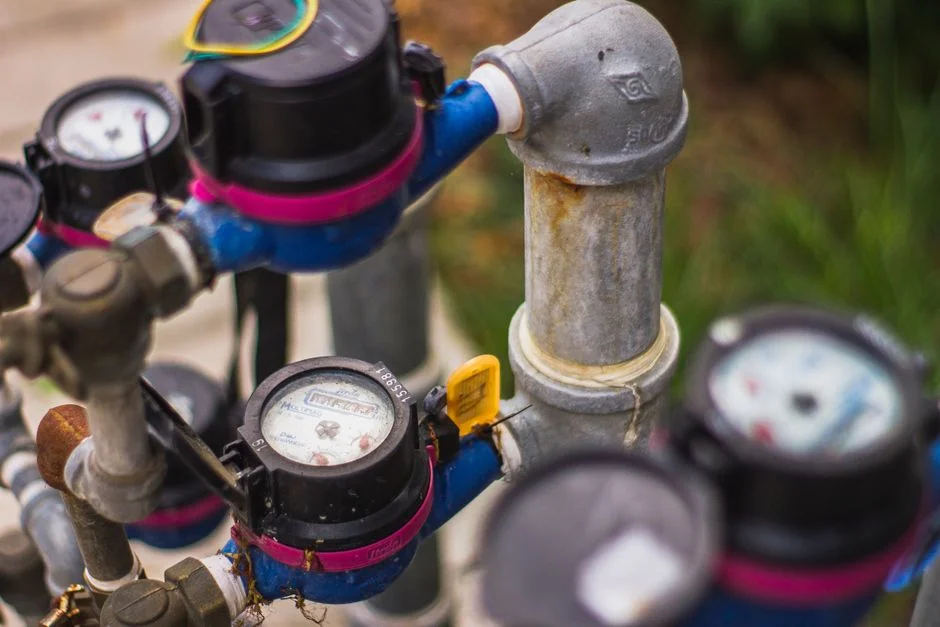
Layer 1 — Metering and field instrumentation. Smart electricity meters at the MV/LV switchgear (CT/PT class 0.2S, per IEC 62053-22) feed submetering on each process unit. Process instruments include dissolved oxygen probes (Hach, Endress+Hauser, or WTW optical DO at 0-10 mg/L range), magnetic flow meters on aeration tank influents (0.5-1% accuracy), pressure transmitters on blower discharge lines, and power transducers on motors above 30 kW. Without this layer the EMS becomes a dashboard with no measurements to display.
Layer 2 — Control. PLCs handle closed-loop DO control, VFD speed references, and pump staging. The dominant platforms in 2026 WTP retrofits are Siemens S7-1500, Allen-Bradley CompactLogix, and Schneider M580, typically programmed per IEC 61131-3 with structured text for model-predictive aeration logic. This is also the layer that interlocks with chemical dosing — a PLC-controlled chemical dosing skid integrated into the same control network lets the EMS coordinate carbon-source dosing for denitrification against off-peak pumping windows.
Layer 3 — SCADA/HMI. Real-time dashboards expose kWh/m³, specific energy (kWh/kg BOD removed, kWh/kg N removed), and alarm thresholds on energy deviation greater than 10% from a rolling 30-day baseline. The SCADA also serves as the human interface for the energy team — operators must see energy alongside flow, not in a separate silo.
Layer 4 — Energy analytics and optimization. Trend logging at 1-minute resolution, KPI calculation, model-predictive aeration control (often a 15-minute horizon rolling forecast of NH₃-N load), and anomaly detection (auto-flagging a blower drawing 12% more kWh at the same airflow). Communication protocols across the stack: Modbus TCP and OPC UA at the control layer, IEC 61850 for substation IEDs where the EMS is integrated with utility billing, and MQTT for cloud analytics.
ISO 50001 sits above these four layers as the management system — the Plan-Do-Check-Act loop, the energy review, and the energy performance indicators (EnPIs) that turn telemetry into a certifiable program.
| Layer | Function | Typical Hardware | Key Output |
|---|---|---|---|
| 1. Metering & field | Submeter process units | Class 0.2S power meters, DO probes, magmeters, PTs | Raw kW, mg/L, m³/h at 1-min resolution |
| 2. Control (PLC) | Closed-loop DO, VFD refs, pump staging | S7-1500, CompactLogix, M580 | Setpoints, VFD speed %, pump starts/h |
| 3. SCADA/HMI | Visualization, alarms, operator HMI | WinCC, Ignition, Wonderware, iFIX | Real-time kWh/m³, deviation alarms |
| 4. Analytics & optimization | EnPIs, MPC, anomaly detection | Siemens Energy Manager, EcoStruxure, cloud stacks | Hourly/daily KPIs, optimization recommendations |
| Management system | EnMS governance | ISO 50001 program | Auditable EnPIs, objectives, corrective actions |
High-Impact Optimization Targets: Where the Savings Actually Live
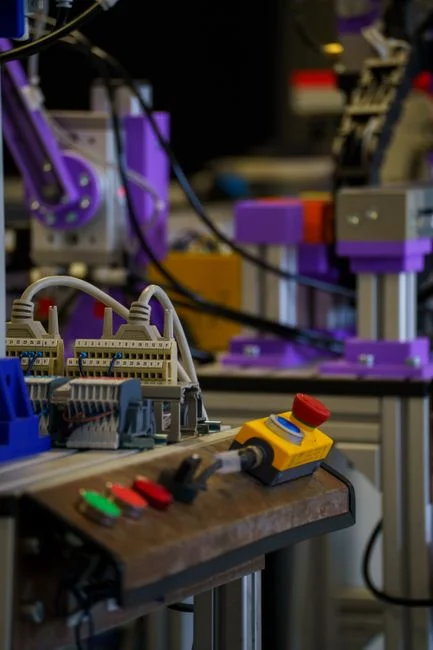
Aeration is the single largest line item and the first project to fund. The biggest lever is dissolved oxygen setpoint optimization: moving the target from the legacy 2.0-2.5 mg/L down to 1.5-2.0 mg/L, combined with ammonia-based aeration control (an NH₃-N trigger above 1 mg/L raises the DO setpoint, a value below 0.5 mg/L allows it to relax), typically saves 20-40% on blower electricity. The savings come from a non-linear oxygen-transfer curve — every 0.5 mg/L reduction in DO setpoint can yield 8-15% in alpha-factor-corrected blower power reduction, and the effluent ammonia-nitrogen stays compliant because the control loop is responding to it directly.
Blower VFD retrofits on positive-displacement or high-speed turbo units are the second lever. The capital cost is project-dependent but typically returns 1.5-3 years payback at 2026 industrial tariffs. An MBBR operating cost benchmarks for 2026 analysis from this site shows that on a 50,000 m³/day MBBR plant, blower VFDs plus DO control together delivered 32% plant-wide electricity reduction, the dominant contributor in the OPEX stack.
Pumping is the third hotspot. Variable-speed pumping on lift stations and recirculation lines, governed by affinity-law control (power scales with the cube of speed), typically saves 15-30% versus throttled flow at fixed speed. Sludge dewatering is often overlooked: scheduling decanter centrifuges and screw presses into off-peak tariff windows, monitored by the EMS, can shift 10-20% of sludge OPEX into cheaper brackets without changing throughput. For plants in high-irradiation regions, 200-500 kWp rooftop solar paired with EMS-controlled blower load-shifting is now a 2026 default in new designs, with payback 4-6 years where grid tariffs are above $0.12/kWh.
EMS Platform Comparison: From SCADA Add-Ons to AI-Driven Optimization
The right tier depends on plant size, existing SCADA footprint, and whether ISO 50001 certification is on the roadmap. A buyer evaluating vendor proposals should map requirements to the tiers below before issuing an RFP.
Tier 1 is a native SCADA energy module — WinCC Energy, Wonderware, iFIX, or Ignition with an energy-analytics perspective. It is suitable for plants below 20,000 m³/day where capex is constrained and the team has SCADA in-house. Expect limited analytics, manual optimization, and EnPIs computed in spreadsheets.
Tier 2 is a standalone industrial EMS — Siemens Energy Manager Pro, Schneider EcoStruxure Power Operation, ABB Ability Energy Manager. These cover mid-size plants from 50,000 to 200,000 m³/day with full ISO 50001 EnPI tracking, energy reviews, and audit-ready reporting. They integrate with the existing SCADA rather than replacing it, and they support both on-premises and hybrid cloud deployment.
Tier 3 is a cloud-native AI EMS — AccuSched, Imflux, or AWS/Azure IoT stacks with custom analytics. These add model-predictive aeration, anomaly detection, and integration with utility demand-response programs. They require strong IT/OT cybersecurity posture and careful attention to regional data-residency rules in the EU and China. Capex benchmarks for a mid-sized WTP: Tier 1 $50-150k, Tier 2 $200-600k, Tier 3 $500k-2M, all figures project-dependent and excluding field instrumentation.
| Tier | Typical Plant Size | Examples | Analytics Depth | Capex Range (USD) | ISO 50001 Fit |
|---|---|---|---|---|---|
| 1. Native SCADA module | < 20,000 m³/day | WinCC Energy, Ignition + Energy Analytics | Manual, kWh/m³ dashboards | $50-150k | Basic EnPIs only |
| 2. Industrial EMS | 50,000-200,000 m³/day | Siemens Energy Manager Pro, EcoStruxure, ABB Ability | Full EnPI tracking, energy reviews | $200-600k | Certifiable |
| 3. Cloud-native AI EMS | 50,000+ m³/day | AccuSched, Imflux, AWS/Azure IoT stacks | MPC aeration, anomaly detection, DR integration | $500k-2M | Certifiable + predictive |
Building the Business Case: ROI and Payback Math for a 2026 EMS Project
The financial model is two formulas: Annual savings = (baseline kWh × savings %) × electricity tariff and Payback = EMS capex / annual savings. Run them with conservative inputs and you have a document the CFO will sign.
Worked example for a 50,000 m³/day plant. Baseline aeration load: 1,800 MWh/year (roughly 40% of a 4,500 MWh/year plant total). Achievable savings on aeration from DO control alone: 25%. That is 450 MWh/year, or $45,000/year at $0.10/kWh. A Tier 2 EMS capex of $400k for software and integration gives payback around 8.9 years on the software line alone — which is why the EMS is almost never justified on its own. Stack it with a blower VFD retrofit ($600-900k capex) and the same DO-control logic now drives 30-40% blower savings, payback drops to 2-3 years for the combined project, and the EMS becomes the operating system for a defensible capex package.
Stacking effect at plant scale: VFDs plus DO control plus off-peak sludge scheduling plus pump VFDs typically delivers 15-30% plant-wide savings, equivalent to $200-900k/year on a $1.5-3M/year electricity bill. Non-energy benefits that should be monetized in the model: Scope 2 CO₂ reduction (the same kWh savings translate directly to tCO₂e for CSRD/ISSB reporting), avoided peak-demand charges, extended blower bearing life (1.5-2× with VFD operation below rated speed), and reduced chemical use from stable aeration. Sensitivity: at $0.15/kWh the same Tier 2 EMS project pays back in 1.5-2.0 years, and electricity price is the dominant ROI lever. For plants pairing the EMS with advanced process control, the AI process control for sewage treatment guide details the model-predictive layer that sits on top of the EMS and accelerates the same payback curve.
Implementation Roadmap: From Energy Audit to Continuous Improvement
A defensible EMS delivery plan maps ISO 50001 stages to real WTP activities over roughly 12 months. The phase boundaries below assume a 50,000-100,000 m³/day plant with a functioning SCADA already in place.
- Phase 1 (months 0-2) — ISO 50001 energy review: walk-down audit, submetering plan by process unit, baseline kWh/m³ calculation, EnPI selection (typically kWh/m³ treated, kWh/kg BOD removed, kWh/kg N removed).
- Phase 2 (months 2-5) — Quick wins: install submetering on the top 10 loads, enable VFDs already on site but running at fixed speed, retune DO setpoints to 1.5-2.0 mg/L, train operators on the energy dashboards.
- Phase 3 (months 5-10) — Capital projects: blower VFD retrofit, pump VFDs, advanced aeration control, and optional Tier 2 or Tier 3 EMS rollout. A predictive maintenance for sewage treatment system can be co-deployed in this phase since it shares the same instrumentation layer.
- Phase 4 (months 10-12+) — Operationalize the EnMS: management review, energy objectives and targets, corrective action loop, annual energy review aligned with ISO 50001 audit cycle.
Three pitfalls kill more EMS projects than bad technology. First, under-metering — you cannot optimize what you do not measure, and submetering below the main incomer is non-negotiable. Second, ignoring operator engagement; the EMS fails if the night shift treats the dashboard as decoration. Third, treating the EMS as an IT project instead of an operational one — the EnMS is a process, not a software install.
Frequently Asked Questions
What is a water treatment plant energy management system? A WTP EMS is an integrated hardware-and-software stack — smart meters, PLCs, SCADA, and energy analytics — that continuously monitors and optimizes electricity use across aeration (50-60% of plant load), pumping (15-25%), and sludge handling (HydropureWater field data, 2026).
How does ISO 50001 apply to water treatment plants? ISO 50001 provides the EnMS governance layer above the EMS hardware: the Plan-Do-Check-Act loop, energy reviews, and energy performance indicators (EnPIs) such as kWh/m³ treated and kWh/kg BOD removed (per ISO 50001:2018).
What is the typical payback for an EMS at a WTP? Software-only Tier 2 EMS payback runs 6-9 years; stacked with blower VFD retrofits and DO control, the combined project pays back in 1.5-3 years at 2026 industrial tariffs of $0.10-0.15/kWh.
Which EMS tier should a 50,000 m³/day plant choose? A 50,000 m³/day plant typically fits Tier 2 (industrial EMS like Siemens Energy Manager Pro or EcoStruxure) for ISO 50001 certification, with Tier 3 cloud analytics added if model-predictive aeration is on the roadmap.
What is the biggest single energy savings lever in a WTP? Aeration control — lowering DO setpoint to 1.5-2.0 mg/L with ammonia-based trim, paired with blower VFDs, delivers 20-40% blower electricity reduction, the largest single line item at 50-60% of plant load.
Related Equipment
- MBR membrane bioreactor system — specifications, capacity range, and technical data
- multi-media filter — specifications, capacity range, and technical data