Why Sequencing Batch Reactors Fit Aquaculture Wastewater
An SBR (sequencing batch reactor) treats aquaculture wastewater in timed fill–react–settle–decant–idle cycles, achieving 70–95% TAN removal and 60–90% COD reduction when properly configured. For shrimp systems, halotolerant biomass acclimation over 2–4 weeks maintains nitrification above 20 ppt salinity. Containerized SBR packages for 10–500 m³/day now ship at $25,000–$180,000 CAPEX in 2026.
The proof point that sequencing batch reactor aquaculture treatment is technically credible sits in Kilgen's 2007 study, which ran an SBR on a low-salinity (3 ppt) raceway shrimp system and demonstrated sustained nitrification under real feed-cycle loading — published in International Biodeterioration & Biodegradation 59:16–19. That single result, however, covers only a narrow salinity band. Most commercial shrimp farms run 15–35 ppt marine systems, and most fish RAS operations push TAN to 20–50 mg/L during peak feeding windows.
Aquaculture influent typically falls into a tight design envelope: TAN 5–50 mg/L, nitrite-N 0.5–10 mg/L, COD 100–800 mg/L, TSS 50–400 mg/L. Within that envelope, the SBR's defining engineering advantage is load equalization: feed-driven ammonia spikes of 2–4× baseline arrive within hours, and the fill phase buffers them in a way continuous-flow systems cannot. Add a defined settle phase and you get solids separation in the same vessel — no secondary clarifier, no return-sludge loop. The rest of this article walks through the cycle timing, the salinity tuning, the SBR vs MBR vs MBBR trade-off, and 2026 cost bands so you can size and budget a system before requesting quotes.
SBR Cycle Design Parameters for Aquaculture Effluent
The SBR cycle for ammonia-dominated aquaculture effluent runs 6–12 hours total, with the react phase consuming 60–70% of that time. Nitrification kinetics for halotolerant biomass at 20–30°C require 4–8 hours of aerated contact to push TAN below 1–2 mg/L — a reaction time, not a residence time, so the fill phase is treated as already loaded when the timer starts.
| Phase | Typical Duration | Purpose / Key Control |
|---|---|---|
| Fill | 0.5–1.5 h | Equalize influent spike; static fill (no aeration) for anoxic denitrification, aerated fill for nitrification-only |
| React | 4–8 h | Aerate to 2–4 mg/L DO for nitrification; insert anoxic sub-phase (0.5–1 h, DO < 0.5 mg/L) for TN removal in reuse loops |
| Settle | 1–2 h | Quiescent solids separation; surface overflow rate ≤ 1.0 m/h to keep TSS capture above 90% |
| Decant | 0.5–1 h | Decant 25–35% of working volume via floating weir; velocity < 1.5 m/h to avoid solids resuspension |
| Idle / Sludge Waste | 0.5–1 h | Wasted at 0.3–0.6 kg DS per kg BOD removed; buffer for cycle-time slippage |
Operating targets for aquaculture-strength loading sit at MLSS 3,000–5,000 mg/L and F/M 0.05–0.15 kg BOD/kg MLSS·d. Below 0.05 the biomass starves and nitrifier fraction collapses; above 0.15 settling deteriorates and TSS carryover into the decanted supernatant climbs past 50 mg/L. Temperature is the silent constraint: the 20–30°C window is the design sweet spot, nitrification rate roughly halves below 15°C, and above 35°C nitrifier washout accelerates — a real risk in summer shrimp ponds in tropical climates where reactor mixed liquor can exceed 38°C without shading or chilled makeup water. For total nitrogen removal (relevant where discharge permits cap TN at 15–20 mg/L), slot a 0.5–1 hour anoxic window into the react phase, dose external carbon if COD:TN in the raw influent falls below 5:1, and keep DO below 0.5 mg/L during that sub-phase only.
Salinity Is the Make-or-Break Variable for Shrimp Systems
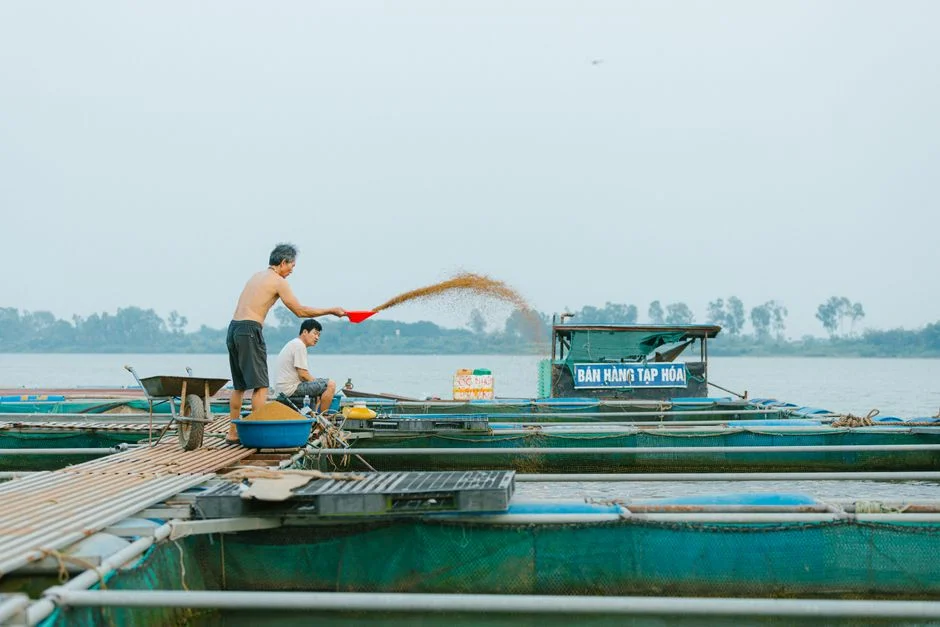
Standard freshwater SBR biomass loses roughly 50% of its nitrification rate above 20 ppt salinity without prior acclimation — the single largest design risk for marine shrimp systems. The 3 ppt Kilgen (2007) baseline sits a full order of magnitude below typical L. vannamei production salinity, so the result is real but not directly transferable. Halotolerant nitrification at commercial scale is an acclimation problem before it is an equipment problem.
The acclimation protocol that field data (HydropureWater, 2025–2026 shrimp RAS commissioning projects) supports runs 4–6 weeks: start biomass at 5–8 ppt, raise reactor salinity by 2–3 ppt per week, and seed with either acclimated return sludge from an existing marine system or a commercial marine nitrifier culture. Skipping the ramp or jumping from 5 ppt to 25 ppt in a week typically causes a 30–60% TAN-spike episode that takes 2–3 weeks to recover from — longer than the acclimation period it was supposed to replace.
| Reactor Salinity | TAN Removal (acclimated biomass) | Design Implication |
|---|---|---|
| 0–5 ppt (freshwater / low-salinity) | 90–95% | Standard SBR sizing applies; 6–8 h total cycle |
| 10 ppt | 85–90% | Modest 10–15% react-phase extension |
| 20 ppt | 70–80% | Extend react to 6–8 h; verify MLSS stability weekly |
| 30 ppt | 55–65% | React 8–12 h or plan parallel MBR polishing |
| 35 ppt | 45–55% | Consider MBR or hybrid SBR+MBR; verify with bench test |
At 30–35 ppt, plan honestly for either a longer react phase (8–12 hours, which means fewer cycles per day and a larger tank for the same daily throughput) or a downstream MBR polishing step to recover effluent quality. Pretending the 0 ppt removal number holds at 30 ppt is the most common engineering error in marine shrimp SBR retrofits.
SBR vs MBR vs MBBR for Aquaculture: Which Process Wins?
The three leading biological options for aquaculture wastewater each win on a different axis, and the right choice depends on whether your binding constraint is capital cost, effluent quality, or load variability. The comparison below uses a 100 m³/day design flow with 25 mg/L TAN influent as the reference case.
| Process | Effluent TSS | Effluent TAN | Footprint (m²/m³·d) | CAPEX Index | OPEX Index | Shock-Load Handling | Salinity Tolerance |
|---|---|---|---|---|---|---|---|
| SBR | 20–50 mg/L | 1–5 mg/L | 0.10–0.15 | 1.0× (baseline) | 1.0× | Excellent (batch equalization) | Good with 4–6 wk acclimation |
| MBR | < 1 mg/L | < 1 mg/L | 0.04–0.06 | 1.8–2.2× | 2.0–4.0× | Good | Good; membrane flux drops ~20% at 30 ppt |
| MBBR | 30–80 mg/L | 2–8 mg/L | 0.08–0.12 | 1.1–1.3× | 0.9–1.1× | Fair (continuous-flow, no equalization) | Good with acclimated carriers |
The SBR's edge is shock-load handling and capital cost: the fill phase absorbs feed-driven TAN swings of 2–4× without effluent penalty, and there are no membranes to replace. Its weakness is effluent TSS at 20–50 mg/L, which falls short of reuse-quality thresholds for most high-density RAS loops — pair it with a lamella clarifier for TSS polishing if you need to push below 20 mg/L. MBR delivers < 1 mg/L TSS and near-reuse water, with roughly 60% smaller footprint than SBR via a compact MBR membrane bioreactor system, but membrane fouling from fish mucus and colloidal protein drives OPEX 2–4× higher. MBBR's continuous-flow simplicity suits large, stable loads with low operator skill, but it cannot equalize harvest or feeding spikes and needs a separate clarifier. Decision rule: variable load and budget focus → SBR; reuse-quality demand and tight footprint → MBR; large stable flow with minimal operations → MBBR.
2026 CAPEX and OPEX for Containerized Aquaculture SBR
Containerized and skid-mounted SBR packages have compressed aquaculture-project lead times from 8–12 months to 8–14 weeks because the tank, blowers, fine-bubble diffusers, PLC, and floating decanter ship as a pre-commissioned unit. The 2026 cost bands below assume a turnkey electrical and controls scope; civil works, freight, and installation are itemized separately.
| System Size | Configuration | CAPEX Range (USD, 2026) | What's Included |
|---|---|---|---|
| 10 m³/day | Single skid, HDPE / FRP tank | $25,000–$45,000 | Tank, blower, diffusers, PLC, decanter, basic DO/pH probes |
| 100 m³/day | 20 ft or 40 ft containerized | $90,000–$140,000 | Dual-tank sequencing, aerobic reactor, integrated control panel |
| 500 m³/day | Dual-tank concrete or dual-container | $150,000–$180,000 | Two reactors, redundant blowers, full SCADA, alkalinity dosing skid |
OPEX runs $0.08–$0.22 per m³ treated, dominated by aeration energy at 0.4–0.8 kWh/m³ (60–70% of the OPEX stack) and sludge hauling. Civil works and site prep typically add 20–35% to CAPEX on greenfield shrimp farms, while retrofit RAS shed installations run a 10–15% premium for tight fit-out and confined crane access. For readers comparing the SBR against newer biofilm alternatives, the MABR vs MBR operating cost comparison provides a useful third data point on aeration energy benchmarks at comparable loading.
Pre-Design Checklist Before SBR Sizing
Run through this list with your engineer or include it verbatim in the RFQ you send to vendors. Each item below either constrains the design or pushes a specific cost line item, and skipping any one of them tends to surface as a change order six months into commissioning.
- Peak vs average daily flow (m³/day) — and the hourly feed-cycle pattern that drives TAN swing
- Influent characterization: TAN, nitrite-N, COD, TSS, BOD₅, alkalinity, pH, temperature
- Salinity range across the production cycle (shrimp ponds shift 3–8 ppt during molting and water top-up)
- Temperature range at the reactor location, including summer extremes if above 30°C
- Target effluent limits — which standard applies: local aquaculture discharge, EU BAT, China GB, EPA?
- Available footprint, headroom for crane access, and proximity to aeration blower noise limits
- Power supply (3-phase availability, generator backup for oxygen-dependent species)
- Operator skill level and remote-monitoring requirement
- Sludge handling and disposal plan (SBR produces 0.3–0.6 kg dry solids per kg BOD removed)
Two pitfalls recur across the 2024–2026 HydropureWater commissioning data: undersizing the sludge-wasting system, which forces longer settle phases and cuts effective reactor volume by 15–25%, and ignoring the 4–6 week salinity acclimation ramp in the project schedule, which compresses startup and triggers TAN excursions during the first production cycle. Plan for both upfront. Downstream of the SBR, a lamella clarifier handles residual TSS polishing and an automatic chemical dosing system maintains alkalinity and pH during peak nitrification when bicarbonate consumption runs 7.14 mg CaCO₃ per mg TAN oxidized.
Frequently Asked Questions
How long does the SBR react phase need to be for shrimp wastewater at 25 ppt salinity?
Plan 6–8 hours of react time with acclimated halotolerant biomass, verified by a 2–3 week bench test on site water before sizing the tank. Below 6 hours, TAN carryover typically exceeds 5 mg/L at 25 ppt, which violates most reuse-loop thresholds. Above 8 hours, the marginal TAN removal drops below 10% and you are paying for tank volume you don't need.
Can an SBR match MBR effluent quality for RAS reuse loops?
Not directly — SBR effluent runs 20–50 mg/L TSS versus < 1 mg/L for an MBR membrane bioreactor system — but pairing the SBR with a lamella clarifier and drum filter typically pushes TSS below 10 mg/L, which is adequate for many freshwater and low-salinity RAS loops. For near-reuse quality at higher salinity, an MBR or hybrid SBR+MBR is the honest answer.
What does a 50 m³/day containerized SBR cost in 2026?
Expect $60,000–$95,000 CAPEX for the unit itself, plus 20–35% for site prep and installation on a greenfield site, putting a turnkey installed system in the $75,000–$130,000 range. OPEX typically lands at $0.10–$0.18 per m³ treated depending on local power tariffs and sludge disposal costs. For broader fish processing wastewater treatment plant pricing data at adjacent flow rates, the linked guide provides useful cross-reference.
How do I acclimate SBR biomass to marine salinity without losing a production cycle?
Run the reactor at 5–8 ppt for one week with freshwater or low-salinity seed, then raise salinity by 2–3 ppt per week over 4–6 weeks until you reach the target. Seed with acclimated return sludge from a marine system or a commercial marine nitrifier culture to compress the ramp by roughly 30%. Expect a 20–40% TAN-spike episode at each step change; do not step up faster than the biomass can recover.