What Drives the Price of a Fish Processing Wastewater Treatment Plant in 2026
A fish processing wastewater treatment plant in 2026 costs $180,000–$3,500,000 in CAPEX and $0.32–$1.85 per m³ in OPEX, depending on design flow (50–2,000 m³/day) and influent strength. Standard process trains combine rotary screening, dissolved air flotation (DAF), equalization, biological treatment (MBR or SBR), and disinfection. High FOG and salinity from brining operations drive the DAF and biological sizing more than flow rate alone.
Four variables decide which end of that range your project lands on:
- Design flow (m³/day): the single most quoted number, but the most misleading if used in isolation.
- Influent loading: BOD 800–6,000 mg/L, COD 1,500–9,000 mg/L, FOG 200–1,500 mg/L, TKN 80–400 mg/L, salinity 0.5–3.5% NaCl — a fishmeal stickwater stream at 30,000+ mg/L BOD is a different plant than filleting washwater at 1,200 mg/L BOD.
- Discharge standard: coastal ocean outfall permits typically accept 50–100 mg/L BOD; inland reuse or surface-water discharge often requires <30 mg/L BOD and <10 mg/L TSS, which forces MBR + RO polishing.
- Level of automation: manual SCADA versus full PLC with remote monitoring adds 8–12% to CAPEX but cuts labor OPEX from 15–20% down to 5–8%.
Flow rate alone is a misleading price indicator. A 500 m³/day plant treating fishmeal stickwater typically costs 1.8× a 500 m³/day filleting plant, because the higher organic load and salinity force a larger biological reactor, oversized DAF air-to-solids ratio, and more aggressive corrosion allowance. Per the Treatment of Seafood Processing Wastewater review (Lenox Institute of Water Technology), DAF is the de-facto pre-treatment for seafood streams because it removes 60–90% of FOG and 70–85% of TSS in a single stage, which is why DAF sizing — not flow rate — is the real CAPEX driver in 2026.
Influent Characteristics That Set the Engineering Baseline
Before sizing a single tank, an engineer needs the influent parameter envelope. Fish processing streams vary by sub-sector more than most food industries, and a regulator will want to see these numbers in the design basis.
| Parameter | Filleting | Canning | Surimi | Fishmeal / Stickwater |
|---|---|---|---|---|
| BOD (mg/L) | 800–2,500 | 1,500–4,000 | 2,000–5,000 | 10,000–30,000+ |
| COD (mg/L) | 1,500–4,500 | 2,500–7,000 | 3,000–8,000 | 20,000–50,000 |
| TSS (mg/L) | 500–1,800 | 800–2,500 | 1,000–3,000 | 2,000–5,000 |
| FOG (mg/L) | 200–800 | 400–1,200 | 300–900 | 500–1,500 |
| TKN (mg/L) | 80–200 | 120–300 | 150–350 | 250–400 |
| Salinity (% NaCl) | 0.3–1.5 | 0.5–2.5 | 0.5–2.0 | 0.5–3.5 |
| pH | 6.0–8.0 | 5.5–7.5 | 6.0–7.5 | 6.5–8.5 |
| Temperature (°C) | 18–25 | 20–30 | 20–28 | 25–32 |
Bloodwater and fishmeal condensate can spike above 30,000 mg/L BOD — equalization and dedicated side-stream handling are mandatory, not optional. Any design that routes these flows straight to the main biological stage will fail on day one of a peak shift (HydropureWater field data, 2026).
Seasonality is the second non-negotiable. Harvest seasons routinely push peak daily flow to 2–3× the annual average, and the equalization basin must be sized for the worst week, not the mean. A 12 h hydraulic retention time (HRT) at average flow is the minimum; 24 h HRT is the safer bet for surimi and canning lines where product mix shifts quickly.
Temperature sensitivity is the third sleeper issue. Influent at 18–32 °C shifts biological kinetics by 30–50% across that range and changes DAF air-to-solids ratio — colder raw water holds less dissolved air, so the recycle rate has to compensate or FOG removal efficiency drops. Plant designers in temperate climates should plan for 20–32 °C operation, not just summer averages.
The Standard 2026 Process Train: Stage by Stage
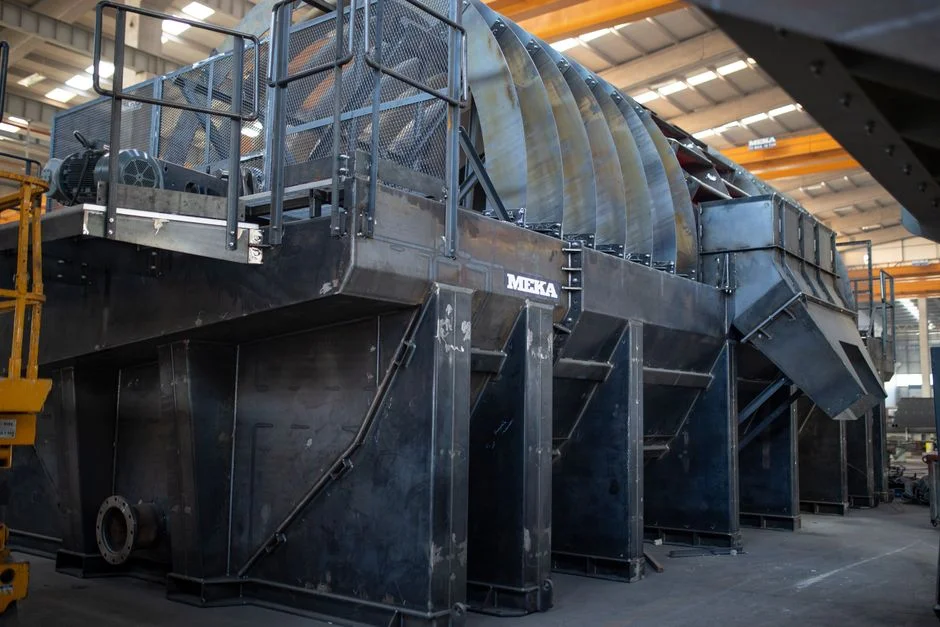
Below is the unit-operation sequence a 2026 fish processing wastewater treatment plant should follow, with the cost share and sizing logic for each stage.
- Rotary mechanical bar screen (GX series): first defense, removes solids ≥2 mm that would otherwise blind the DAF and shred biological reactor mixers. Typical CAPEX share 5–10%. Sized for peak instantaneous flow, not daily average.
- Grit and FOG pre-removal: optional but recommended for plants receiving fish with sand or shell debris (shellfish, bottom fish). Protects pump mechanical seals and DAF feed pumps.
- Dissolved air flotation (DAF, 4–300 m³/h range): the workhorse for FOG and colloidal solids in seafood processing effluent treatment. Achieves 60–90% FOG removal and 70–85% TSS removal in a single stage. A 200 m³/h dissolved air flotation system typically represents 15–20% of total equipment CAPEX.
- Equalization basin: HRT 8–24 h, dampens flow and load swings. Only 5–10% of CAPEX, but proper sizing reduces downstream biological volume by 20–30% — the cheapest 20% saving on the whole project.
- Biological treatment: an integrated MBR membrane bioreactor (10–2,000 m³/day range, <1 μm effluent) is preferred where footprint is limited or water reuse is a target. SBR or conventional activated sludge remains a CAPEX-leaner alternative for plants with inland discharge to a municipal sewer at 250–500 mg/L BOD limits.
- Disinfection: a chlorine dioxide generator (50 g/h to 20,000 g/h, compliant with EPA, EU 98/83/EC, and WHO drinking-water guidelines) is preferred over sodium hypochlorite in saline streams because chlorine reacts with bromide to form bromate, which is regulated. UV is technically viable but adds 30–40% to the disinfection CAPEX line item.
- Sludge dewatering: a plate and frame filter press (1–500 m² filtration area) handles the high-protein, high-oil sludge that DAF and biological stages produce. Expect 18–25% dry solids cake, suitable for off-site fishmeal rendering or anaerobic digestion.
Total installed CAPEX for the train breaks down as: DAF + biological reactor + membrane modules = 45–55% of equipment cost; civil works and erection = 20–30%; instrumentation and automation = 8–12%; engineering and commissioning = 5–10%. Screening at the head of the works uses a GX series rotary mechanical bar screen sized to peak flow.
CAPEX Breakdown by Flow Tier (2026 Pricing)
The table below maps flow rate to a defensible 2026 turnkey budget, inclusive of equipment, civil works, installation, instrumentation, and commissioning (HydropureWater field data, 2026). These are mid-range numbers; coastal-reuse or fishmeal-stickwater projects sit at the upper end.
| Design Flow (m³/day) | Equipment CAPEX (USD) | Civil Works % | Installation % | Turnkey Total (USD) | Unit Cost ($/m³/day) |
|---|---|---|---|---|---|
| 50 | 95,000–135,000 | 30–35% | 18–22% | 180,000–250,000 | 3,600–5,000 |
| 100 | 170,000–240,000 | 28–32% | 17–20% | 320,000–430,000 | 3,200–4,300 |
| 250 | 380,000–540,000 | 25–30% | 15–18% | 720,000–1,000,000 | 2,880–4,000 |
| 500 | 680,000–950,000 | 22–28% | 14–17% | 1,250,000–1,700,000 | 2,500–3,400 |
| 1,000 | 1,200,000–1,700,000 | 20–25% | 13–16% | 2,100,000–2,800,000 | 2,100–2,800 |
| 2,000 | 2,100,000–2,900,000 | 18–22% | 12–15% | 3,400,000–3,500,000+ | 1,750–2,200 |
The unit-cost curve shows clear economy of scale: $/m³/day CAPEX drops from ~$3,600 at 50 m³/day to ~$1,750 at 2,000 m³/day. Most of that drop comes from the biological stage, where reactor volume scales sub-linearly with flow once HRT and MLSS targets are fixed.
Containerized or package plants for the 50–200 m³/day tier save 15–20% on civil works but carry a 10–15% equipment premium. They make sense for sites with limited construction windows or remote locations. For plot-constrained mid-size projects, an integrated MBR membrane bioreactor delivers a 60% smaller footprint than conventional activated sludge, which can save six figures on land and civil work in coastal-port real estate.
OPEX Breakdown: What $0.32–$1.85 per m³ Actually Buys You
OPEX is where most 5- and 10-year business cases succeed or fail. The line items below add up to the $0.32–$1.85/m³ range quoted at the top of this article, and each is negotiable.
| OPEX Line Item | Share of Total OPEX | Typical Unit Driver | Lever to Pull |
|---|---|---|---|
| Electricity | 35–45% | 0.8–2.5 kWh/m³ at $0.08–0.14/kWh | VFDs on recycle and aeration blowers |
| Chemicals (coagulant, polymer, ClO₂) | 15–25% | $0.05–0.40/m³ | Polymer dose optimization, on-site ClO₂ generation |
| Sludge handling | 15–20% | $40–120/tonne wet cake hauled | Digester integration, fishmeal off-take credit |
| Labor | 10–20% | 1–3 FTE per shift | Full automation: 5–8% labor, +8–12% CAPEX |
| Maintenance & consumables | 8–12% | 3–6% of equipment CAPEX/yr | See DAF maintenance and consumables cost 2026 |
| Membrane replacement (MBR) | 5–10% | 5–8 yr life, $30–60/m² | Air-scour optimization, CIP protocol |
Electricity is dominated by the DAF recycle pump and MBR permeate pump. Micro-bubble generation alone is the single largest motor load in a fish processing plant, and the recycle pump runs 24/7. Chemicals rank second and are the easiest line item to attack with jar testing — many plants overdose polymer by 20–30%. Sludge handling is the binding constraint, not biological yield, because fish sludge is high-protein and difficult to dewater past 22% DS without thermal conditioning.
The gap between $0.32 and $1.85/m³ is mostly energy intensity, sludge volume factor, and whether the plant pursues water reuse. A 100 m³/day surimi line with on-site reuse will land at $0.90–1.20/m³; a 1,000 m³/day filleting plant with coastal discharge and no reuse will land at $0.35–0.55/m³.
How to Cut Total Cost of Ownership Without Cutting Compliance
Five cost-reduction levers consistently deliver 15–30% TCO savings in fish processing wastewater projects. Each is defensible to a regulator and does not require a permit modification.
- Reuse the MBR permeate. An industrial RO system polishing MBR effluent to boiler-feed or plant-washdown quality can offset 20–35% of freshwater purchase cost, which runs $1.50–4.00/m³ in coastal processing hubs.
- Monetize the sludge. Filter-press cake at 18–25% DS is a viable feedstock for fishmeal or biogas. Digester integration can cut sludge OPEX by 30–40%, and a fishmeal off-take contract at $40–80/tonne turns a hauling cost into a revenue line. See the broader wastewater resource recovery technologies 2026 benchmark for unit economics.
- Right-size the equalization basin. 24 h HRT instead of 8 h allows a smaller, steadier-loaded biological stage — typically 8–12% CAPEX net.
- Install VFDs on DAF recycle pumps, blowers, and transfer pumps. Real-world measured savings are 12–18% on plant electricity, with payback in 18–30 months at current kWh prices.
- Avoid stainless steel over-spec. SS304 is adequate for most fish processing streams. SS316 is only required for brine-contact zones above 5% NaCl — a narrow slice of the process train. Upgrading the whole plant to SS316 adds 8–15% to equipment CAPEX with no compliance benefit.
These levers are also reflected in the broader 2026 industrial wastewater treatment market trends, where energy recovery and reuse are no longer optional differentiators — they are baseline buyer expectations.
Frequently Asked Questions
How much does a fish processing wastewater treatment plant cost in 2026?
Turnkey CAPEX for a fish processing wastewater treatment plant in 2026 ranges from $180,000 for a 50 m³/day package plant to over $3,500,000 for a 2,000 m³/day turnkey installation, with OPEX of $0.32–1.85 per m³ depending on discharge limits and reuse targets (HydropureWater field data, 2026).
What is the typical BOD of fish processing wastewater?
Influent BOD typically runs 800–6,000 mg/L for filleting, canning, and surimi lines, and can spike above 30,000 mg/L from bloodwater and fishmeal stickwater side-streams that require dedicated equalization before biological treatment.
Is DAF or MBR better for high-salinity seafood wastewater?
DAF is the standard pre-treatment and removes 60–90% of FOG and 70–85% of TSS before the biological stage; MBR is the preferred biological step when footprint is limited or the effluent is destined for reuse, because it delivers <1 μm filtrate at salinities up to 3.5% NaCl with proper halotolerant biomass acclimation.
How much does it cost to treat one cubic meter of fish processing wastewater?
Operating cost typically lands at $0.32–1.85 per m³, with electricity (35–45%), chemicals (15–25%), and sludge handling (15–20%) as the largest line items; plants pursuing water reuse and fishmeal sludge credits consistently fall in the lower half of that range.
Can fish processing wastewater be reused?
Yes. MBR followed by an industrial RO polishing stage produces water suitable for plant washdown, boiler feed, and fish transport, and can offset 20–35% of freshwater purchase cost — typically the single largest TCO reduction available to a fish processor in 2026.