Why Fish Processing Wastewater Must Be Chemically Conditioned Before Biological Treatment
Fish processing wastewater (FPWW) carries 800–4,000 mg/L COD, 200–1,200 mg/L FOG, and 100–600 mg/L total suspended solids — a load dominated by emulsified oils, soluble proteins, and fish-meal particulates rather than the simple carbohydrates municipal plants are designed for. A 20 m³/day sardine/mackerel canning line, the reference plant documented in the 2001 Water, Air, & Soil Pollution study, generates wastewater where the protein and lipid fractions together account for more than 60% of the organic load, and where raw influent pH swings between 4.5 and 9.0 depending on cleaning-shift chemistry (per the same 2001 reference plant data).
Biological reactors fed raw FPWW fail in four documented ways: (1) membrane and media clogging from intact fat globules, (2) formation of hydrophobic sludge that floats rather than settles, (3) poor flocculation of biomass due to lipid-coated cells, and (4) dewatering problems and aminated off-odors that turn a plant into an EHS complaint (per the 2019 Springer BMBBR/UASB/FICCO/CAACO study on FPWW bioreactor configuration). Conventional screens and grease traps remove only free oil — they pass emulsified oils in the 1–20 µm range and dissolved proteins straight through to the biological stage.
Chemical conditioning ahead of the reactor is the engineering fix. When FPWW is dosed with coagulant and flocculant before dissolved air flotation, the FOG and protein fractions are precipitated or floated out as a sludge, and the downstream reactor sees a feed that allows 99 ± 0.1% COD removal and 100% lipid removal instead of underperforming under FOG inhibition (per the 2019 Springer configuration study).
How a Fish Processing Wastewater Chemical Dosing System Works
A PLC-controlled automatic chemical dosing system for FPWW is a skid-mounted, pre-wired, factory-tested package built from four functional blocks: a chemical storage tank (PE or HDPE, 200–2,000 L), a metering pump (diaphragm or peristaltic, 0–200 L/h capacity), a static mixer or mixing chamber sized for a velocity gradient (G-value) of 300–800 s⁻¹, and a control panel with PLC plus pH and flow feedback loops. The skid architecture matters because most fish plants run seasonal campaigns (200–280 days/yr for the 20 m³/day reference plant) and need a unit that can be commissioned inside a two-week shutdown window rather than field-assembled.
The dosing sequence is fixed: pH correction first if the influent falls outside pH 6.5–7.5, then coagulant injection into a flash-mix zone with a hydraulic residence time of 30–90 seconds, followed by 2–5 minutes of slow-mix flocculation (G = 50–150 s⁻¹) where the anionic polyacrylamide builds the bridge flocs, and finally discharge into the DAF contact zone where coagulated flocs attach to 20–80 µm micro-bubbles and float to the surface. Clarified subnatant — typically with FOG reduced by 85–95% and TSS by 70–90% — flows by gravity to the equalized biological stage, while the floated sludge is scraped to a holding tank for dewatering.
Controls run on a PID loop tied to influent flow (mag meter, 4–20 mA) and pH (online probe with automatic temperature compensation). A streaming current detector is optional but recommended for plants that see large influent variability — it measures the net surface charge of the suspension and trims coagulant dose in real time, which can cut PAC consumption by 15–25% on a fluctuating fish line (HydropureWater field data, 2026).
Selecting the Right Chemicals: Coagulants, Flocculants, and pH Adjusters
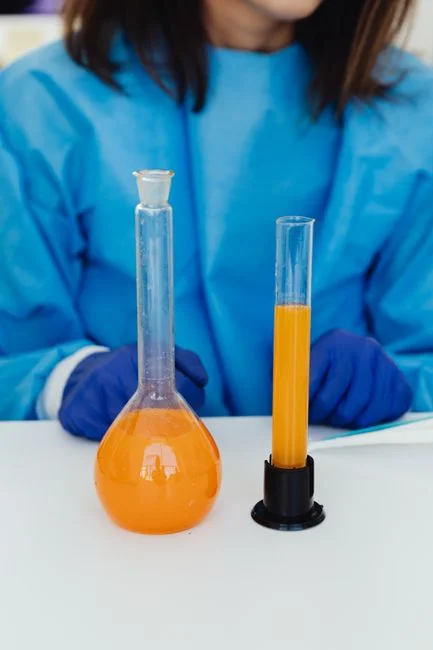
FPWW chemistry favors metal-salt coagulants over cationic polymers because the colloidal load is anionic at typical plant pH — proteins carry a net negative charge above their isoelectric point (pH 4.5–5.5 for most fish proteins), and emulsified oil droplets stabilize via surfactant adsorption with the same negative surface character. The table below summarizes the three coagulants that see real use on fish lines.
| Chemical | Typical dose | Active strength | pH window | Notes for FPWW |
|---|---|---|---|---|
| Polyaluminum chloride (PAC) | 50–300 mg/L | 10–18% Al₂O₃ | 5.0–9.0 | Preferred for fish lines; works across the typical 5.5–8.5 influent band, low alkalinity consumption (saves ~30% on lime vs. ferric chloride). |
| Ferric chloride (FeCl₃) | 30–150 mg/L | 38–45% w/w | 4.0–9.0 | Best protein precipitation; stains PP/PVDF equipment brown, requires PTFE-lined pumps, and adds ~2× the chloride load of PAC. |
| Alum (aluminum sulfate) | 100–400 mg/L | 48–50% Al₂(SO₄)₃ | 5.5–7.5 | Cheapest, but raises sulfate to levels that stress downstream anaerobic reactors; rarely used on FPWW. |
Flocculant selection is where most first-time specs get it wrong. Anionic polyacrylamide (APAM) at 0.5–5 mg/L active, prepared as a 0.05–0.2% solution with charge density 10–30%, is the standard choice for FPWW because it bridges the negatively charged coagulated colloids without competing for charge sites. Cationic polymers (CPAM) are usually wrong for fish protein streams — they neutralize protein charge prematurely, form a slimy precipitate that floats rather than flocculates, and increase sludge volume by 20–40% (HydropureWater field data, 2026). Dose must be jar-tested per batch of raw wastewater; over-dose of APAM re-stabilizes the colloid and degrades DAF performance.
pH correction is the third control loop. The protein isoelectric window of 6.5–7.5 maximizes precipitation, so for an influent at pH 5.0 the skid doses 10–25% NaOH (or 5–10% lime slurry if alkalinity is also low) at 50–200 mL/m³, and for an influent at pH 8.5 it doses 10–30% H₂SO₄. Specialty add-ons include sodium hypochlorite at 5–15 mg/L for odor control on blood-bearing streams from sardine or tuna lines, and silicone or fatty-alcohol anti-foam at 1–10 mg/L when influent surfactants from cleaning-in-place chemicals drive foam at the DAF weir.
Typical 2026 Process Flow: Dosing → DAF → Biological Polish
A modern fish-plant wastewater train runs in four stages, and the chemical dosing skid sits between equalization and flotation — never upstream of the screen, never downstream of the biological reactor. The process flow and the unit-operation sizing window for each stage are summarized below.
| Stage | Unit operation | Design parameter | Typical range for FPWW | Function |
|---|---|---|---|---|
| 1 | Rotary bar screen | Aperture | 2–5 mm | Removes fish solids, scales, fins |
| 2 | Equalization basin | HRT | 8–24 h | Dampens pH, flow, and load swings from batch cleaning |
| 3 | Chemical dosing + dissolved air flotation (DAF) system | HRT, recycle ratio | 15–25 min, 20–30% recycle | Coagulant + polymer injection breaks emulsions, floats FOG and TSS |
| 4 | Biological polish — integrated MBR membrane bioreactor or UASB | Capacity, HRT | 10–2,000 m³/day; MBR HRT 6–12 h, UASB HRT 24–48 h | Removes residual soluble COD/BOD; MBR preferred for reuse-quality effluent |
The DAF platform covers 4–300 m³/h across 13 standard models, which brackets the 20 m³/day reference plant at the low end (≈0.8 m³/h) and scales to a 7,200 m³/day tuna-cannery operation at the high end. Recycle ratio of 20–30% is the standard air-saturation envelope; outside that band, either micro-bubble density drops (poor flotation) or hydraulic loading on the DAF rises (floc shear).
The reason the chemical conditioning stage sits in slot 3, not earlier, is to let the equalization basin absorb the pH and load shocks from batch CIP cleaning. If coagulant is dosed ahead of equalization, the dose is wrong for half the day. MBR is increasingly preferred over conventional activated sludge for FPWW because the membrane barrier holds onto the slowly degrading proteins and lipid residues that would otherwise bleed through a clarifier, and it produces an effluent reusable for non-contact washdown — a real OPEX offset on sites with high water cost.
Sizing the Dosing System: Pump Capacity, Tank Volume, and Control
The worked example below covers a 50 m³/h FPWW stream (≈1,200 m³/day on a 24-h basis, typical of a 200–400 ton/day whitefish or surimi line). At a target dose of 200 mg/L PAC as a 1% active solution, the metering pump must deliver 1,000 L/h, the day-tank needs 7-day storage of 1,680 L (round to 2,000 L), and the flocculant pump at 3 mg/L APAM as 0.1% solution needs 15 L/h into a 1,000 L day-tank. The same logic scales linearly for smaller or larger plants.
| Parameter | PAC skid | APAM skid | pH correction skid |
|---|---|---|---|
| Pump type | Diaphragm metering pump, PVDF head, PTFE diaphragm | Peristaltic, 0.5–2 bar hose pressure | Diaphragm, PP head, EPDM diaphragm |
| Capacity | 0–1,200 L/h (set 1,000 L/h) | 0–60 L/h (set 15 L/h) | 0–300 L/h, modulated by PID on pH |
| Working pressure | 3–5 bar | 1.5–2 bar | 2–3 bar |
| Accuracy | ±1–2% of setpoint | ±2–5% (peristaltic hose wear) | ±1% under PID control |
| Day-tank | 2,000 L HDPE, 1.5″ bulkhead fittings | 1,000 L HDPE, conical bottom, drain valve | 1,500 L HDPE, bundled secondary containment |
| Control input | 4–20 mA from mag meter, optional SCD feedback | Flow-paced from mag meter | 4–20 mA from pH probe, ATC |
| Alarms (must-have) | Tank low-level, pump stroke failure, line blockage | Tank low-level, hose burst detector, mixing motor overload | Tank low-level, pH out-of-band 5.5–8.5, probe failure |
For seasonal fish plants with a 6-month campaign, the day-tank should be sized to 7-day storage at peak dose so the plant does not need a chemical delivery every 72 hours during peak canning weeks. The control panel should land in a non-corrosive enclosure (IP55 minimum, stainless preferred for washdown areas) and integrate with the plant SCADA via Modbus TCP or Profinet — the engineer should not accept a proprietary-only protocol in 2026, because it locks the operator into a single vendor for spares and for any future expansion.
2026 Cost Bands and Selection Checklist for FPWW Dosing Skids
Procurement budgets for a complete chemical dosing skid — including tanks, pumps, mixer, control panel, and pre-wired skid frame but excluding the chemicals themselves and the DAF — cluster in three bands by flow range in 2026. A 5–25 m³/h skid lands at $15,000–$28,000, a 25–100 m³/h skid lands at $30,000–$85,000, and a custom-engineered skid above 100 m³/h lands at $90,000–$220,000 (HydropureWater 2026 quoting data). OPEX is dominated by coagulant: total chemical cost runs $0.04–$0.18 per m³ treated, with PAC at 200 mg/L alone accounting for roughly two-thirds of that figure, and the dosing skid itself draws under 0.3 kWh/m³ of treated flow.
Before issuing the PO, run the procurement decision through this seven-point checklist:
- Flow range: confirm the skid is sized for peak hourly flow, not average daily flow.
- Target FOG and TSS effluent: a 10 mg/L FOG target needs higher PAC dose than a 25 mg/L target.
- Chemical compatibility: PTFE-lined pumps and PVDF heads are mandatory for ferric chloride; do not accept PP-only wetted parts.
- PLC integration: confirm Modbus TCP, Profinet, or EtherNet/IP support for the existing plant SCADA.
- Tank capacity: 5–7 days of storage at peak dose, with bundled secondary containment sized to 110% of the largest tank.
- Service factor: confirm continuous-duty ratings for the metering pump motor, not just intermittent duty.
- Local agent for spares: diaphragm and hose wear parts must be available within 48 hours on-site to avoid extended shutdown during a peak canning run.
For the biological-stage numbers that the dosing skid is feeding into — influent/effluent COD, BOD, and ammonia across MBR or UASB — see the fish processing wastewater COD and BOD removal process guide. For the recurring OPEX on the DAF side that the skid is upstream of, the DAF system maintenance cost 2026 OPEX breakdown breaks out the air-saturation pump rebuild, polymer pump hoses, and sludge-handling costs in detail. For a deeper dive on PAC-specific skid selection, the PAC dosing system manufacturer selection guide covers dosing-pump turndown ratio, Al₂O₃ grade effects on effective dose, and storage-tank venting.
Frequently Asked Questions
What coagulant dose is correct for fish processing wastewater? The engineering starting point is 50–300 mg/L PAC (10–18% Al₂O₃) or 30–150 mg/L ferric chloride, with the actual value jar-tested against the specific raw influent — protein-to-FOG ratio, salt content, and cleaning chemistry all shift the optimum. A 200 mg/L PAC dose is a defensible default for a sardine or mackerel line at 6.5–7.5 pH.
Can chemical dosing alone meet discharge limits for a fish plant? No. Dosing plus DAF typically delivers FOG at 10–25 mg/L and TSS at 30–80 mg/L, which is below the typical NPDES FOG limit of 100 mg/L but not below tighter reuse limits, and it leaves 300–800 mg/L of soluble COD in the effluent. A biological polish — MBR or UASB — is required to reach COD <125 mg/L and FOG <10 mg/L in most jurisdictions.
Is a packaged automatic dosing skid suitable for a small fish plant (5–20 m³/h)? Yes, the 5–25 m³/h skid band is purpose-built for unattended low-flow operation, with PLC control, tank-low-level interlocks, and pump-failure alarms that integrate with the plant SCADA. The smaller skids ship pre-wired so a two-person commissioning crew can bring them online in a single day.
What ROI can be expected from adding chemical dosing to an existing biological plant? Typical payback is 12–24 months, driven by reduced sludge-hauling volumes (DAF float is 3–5% solids vs. 0.5–1% from a clarifier), lower aeration energy in the biological stage (FOG is no longer blocking oxygen transfer), and avoided NPDES non-compliance penalties on FOG and ammonia excursions. Plants in regions with high biosolids disposal cost see the shorter end of that range.