Why 2026 Is the Inflection Year for the Circular Water Economy
The circular water economy for industrial sites is a closed-loop model in which process water is reclaimed, wastewater is reused, salts and nutrients are recovered as sellable byproducts, and the only liquid leaving the fence is treated to a standard high enough for discharge or zero liquid discharge (ZLD). Industry is the segment that moves this market: 60–70% of regional water withdrawals in water-stressed economies are industrial, per UN-Water and OECD basin accounts published in 2024, meaning a regulation or tariff that hits a plant hits the whole water system.
Three 2026 anchors make this the inflection year. First, the global water reuse market is on track to exceed USD 50 billion by 2030 at roughly 9–11% CAGR, with industrial reuse capturing the larger share (BlueTech Research market update, 2025-11). Second, the EU Urban Waste Water Treatment Directive recast and China's 14th Five-Year Plan sub-targets both entered active enforcement windows in 2025–2026, forcing CAPEX line items into board memos from Shandong to Saxony. Third, mainstreamed 2026 industrial wastewater treatment market trends show MBR plus RO as the default reuse train and ZLD as the default in heavy industry, which collapses the engineering risk premium that historically killed reuse projects. The result: 2026 is the first year a finance team can defend a circular water CAPEX line with current tariffs, current regulations, and current equipment performance—not a forecast.
Driver 1: Tightening Industrial Discharge Regulations
Regulatory tightening is the most concrete 2026 driver because it carries a fixed deadline and a fixed penalty. The EU Urban Waste Water Treatment Directive (91/271/EEC) recast adds quaternary treatment for nutrients and micro-pollutants, with implementation tracking for 2026–2027 entry into force; agglomerations above 100,000 PE must meet new effluent ceilings for total nitrogen, total phosphorus, and a watch list of micropollutants. China's Water Ten Plan, reinforced by the 14th Five-Year Plan, continues to mandate ZLD in coal chemical, coking, steel, and oil refining sectors—a regime that has already driven 12–15% annual ZLD adoption growth since 2021 (China Petroleum and Chemical Industry Federation, 2025-09).
On the US side, EPA NPDES industrial permits are tightening, and state reuse rules in California, Texas, and New York now set numeric ceilings for PFAS, TDS, and reuse-quality turbidity that effectively require membrane polishing. The engineering response is consistent across jurisdictions: a DAF pre-treatment system that strips 85–95% TSS and 90–98% FOG upstream of a biological or membrane train, ensuring the downstream process sees a stable feed and the plant stays inside its permit envelope during shock loads. For EHS and compliance leads, the practical 2026 read is: any plant in scope of UWWTD recast, Water Ten Plan, or state PFAS rules should already be running pilot or engineering studies—the rule windows do not slip.
Driver 2: Water Scarcity Pricing and the Reuse Cost Crossover
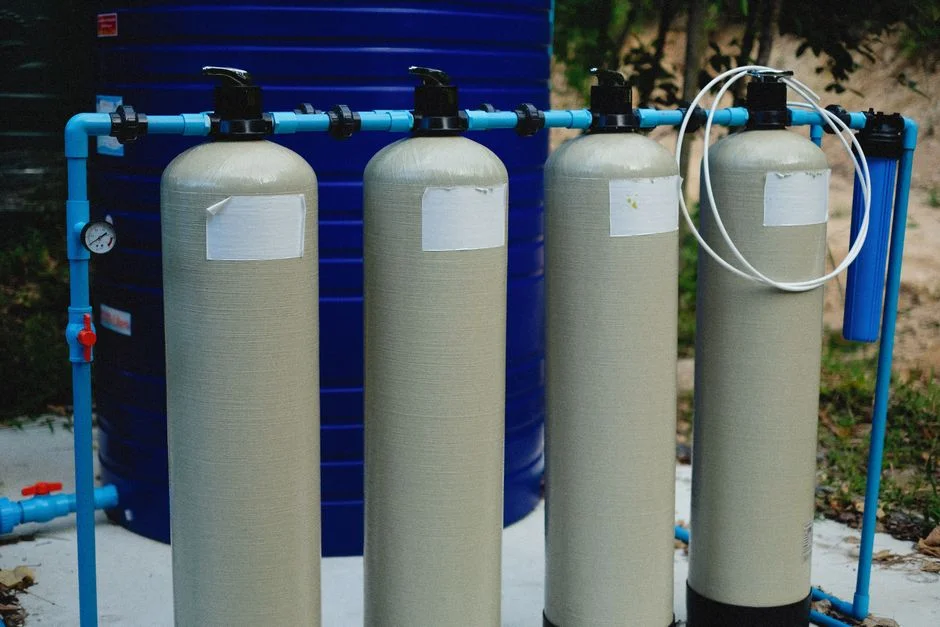
Industrial freshwater tariffs in coastal industrial zones now sit at USD 1.20–4.00/m³, while severe-stress zones in northern China, inland India, and the US Southwest exceed USD 5.00/m³ for high-volume offtakers (IWA Water Tariff Survey, 2025-Q3). Reclaimed water from a properly designed reuse train is delivered at USD 0.80–2.00/m³, and the gap widens every year because freshwater scarcity costs compound while reuse costs drift down with membrane and energy-recovery efficiency.
Translated to a single plant, the math is straightforward. At a 5,000 m³/day industrial demand, switching from purchased freshwater to on-site reclaimed water saves USD 0.5–3 million per year at current tariff spreads, before counting avoided discharge surcharges. Discharge tariffs in regulated river basins now add another USD 0.20–0.80/m³ on treated effluent, which further compresses the reuse payback period. A finance director evaluating a reuse project in 2026 should anchor the case on the local freshwater tariff curve and the local discharge tariff, not on a generic "water savings" assumption. The 2026 desalination and reuse cost curves tracked in our 2026 desalination market growth at 9% CAGR briefing show the crossover is now permanent in most coastal industrial zones.
Driver 3: MBR and RO Reuse Trains Become the Default Engineering Choice
The convergence of water costs and regulation has led to a standardized engineering approach for industrial reuse. Across municipal and industrial reuse plants commissioned in 2024–2025, the dominant train is now MBR followed by RO, with multimedia filtration as RO guard filtration. The operating envelope has converged on a small set of numbers that an engineering team can design to without custom piloting.
| Unit operation | Typical 2026 performance | Design implication |
|---|---|---|
| DAF pre-treatment | 85–95% TSS removal; 90–98% FOG removal | Protects MBR membranes from fouling and shock load |
| MBR | Effluent turbidity <1 NTU; COD <50 mg/L; footprint ~60% smaller than CAS | Eliminates tertiary clarifier; enables direct RO feed |
| Multi-media filter (RO guard) | SDI reduction to <3 | Prevents RO membrane fouling and clean-in-place frequency |
| Industrial RO | Recovery 75–95%; TDS rejection >99% | High-purity reuse for boiler feed, process, or semiconductor |
The MBR membrane bioreactor system at <1 NTU turbidity is the threshold that lets the industrial RO system with up to 95% recovery run without a separate tertiary clarifier, which gives the train its small footprint and predictable OPEX. The multi-media filter upstream of RO keeps SDI excursions from shortening membrane life. For an engineering reader, the 2026 default is no longer a question of "MBR versus conventional activated sludge"—it is a question of how the MBR effluent is polished to meet the end-use spec, whether that is boiler feed, cooling tower makeup, or process rinse water.
Driver 4: ZLD Adoption in Coal Chemical, Power, and Heavy Industry
Zero liquid discharge (ZLD) is the highest-growth segment inside the 2026 circular water market because it is the only compliance path in several Chinese and Indian sub-sectors. ZLD adoption is growing at 12–15% CAGR in coal chemical, coking, and power generation, driven by Water Ten Plan enforcement, state-level discharge quotas, and freshwater scarcity in inland basins (China Petroleum and Chemical Industry Federation, 2025-09; IIT Bombay industrial water review, 2025-08). A standard ZLD train stacks DAF or a high-efficiency sedimentation tank upstream, MBR or MBBR for biological polishing, RO for volume reduction, and a mechanical vapor recompression evaporator or crystallizer for the final brine.
Two pieces of equipment close the resource-recovery loop. The plate-and-frame filter press for sludge dewatering cuts waste haul-off volume, which reduces disposal costs and lifts solids content high enough for co-firing or land-application where permitted. In coal-fired power, integrating a flue gas desulfurization scrubber with the ZLD brine circuit recovers FGD gypsum as a sellable byproduct, turning a waste line into a circular-economy revenue line. A high-efficiency sedimentation tank upstream of the MBR keeps the biological stage stable when the feed swings between boiler blowdown, FGD wastewater, and process condensate. For an EPC or project director evaluating ZLD in 2026, the engineering is mature; the gating items are site-specific brine chemistry and energy cost for the evaporator.
Driver 5: ESG Reporting and Water-Disclosure Mandates
Reporting mandates pull circular water projects from EHS budgets into the CFO's financial planning. In 2026, the CDP Water Security questionnaire, the CSRD/ESRS E3 water disclosure standard, and SASB industrial water metrics are all in active reporting cycles at most listed industrials, and supply-chain disclosure is propagating the same metrics down to mid-cap suppliers. A reuse or ZLD project directly improves disclosed water withdrawal intensity (m³ per unit of production), discharge-quality KPIs, and now reportable circular-economy revenue from recovered struvite, biogas, gypsum, and salts.
The engineering choices inside a reuse loop also have a disclosure angle. On-site disinfection with a chlorine dioxide generator supports safe reuse for hospital and process loops without the regulated disinfection byproducts that come with free chlorine, simplifying the ESG narrative around both water quality and chemical footprint. For a sustainability lead, the 2026 read is: a reuse project is now measurable on three reporting frameworks at once, and the avoided freshwater and avoided discharge line items show up in CSRD E3 as both an environmental indicator and a financial impact. The CFO sees a CAPEX line that improves three disclosed metrics in the same year it is commissioned. The supporting case is detailed in our 2026 industrial resource recovery from wastewater briefing.
2026 Driver-to-Equipment Mapping for Industrial Buyers
The table below condenses the five 2026 market drivers into a decision map for procurement, EHS, or sustainability leads. Each row pairs the driver trigger with the engineering response, the typical performance window, and the equipment category that delivers it.
| Driver | Engineering response | Typical 2026 spec | Equipment category |
|---|---|---|---|
| Regulatory (UWWTD recast, Water Ten Plan, PFAS) | Quaternary polishing + stable upstream TSS/FOG control | 85–95% TSS removal; turbidity <1 NTU post-MBR | DAF + MBR + RO |
| Water cost (USD 1.20–5.00/m³ freshwater) | Replace freshwater offtake with reclaimed water at 5,000 m³/day | Reclaimed at USD 0.80–2.00/m³; 50–80% OPEX offset | MBR + RO + MMF |
| Reuse train standardization | Default to MBR→RO with multimedia guard | RO recovery 75–95%; SDI <3 | MBR, RO, multi-media filter |
| ZLD (coal chemical, power, heavy industry) | Brine volume reduction + crystallization + sludge dewatering | 12–15% CAGR adoption; >95% water recovery | Sedimentation + MBR + RO + filter press |
| ESG water disclosure (CDP, CSRD E3, SASB) | Measured withdrawal intensity, discharge quality, recovered byproducts | m³/unit reduction; gypsum/struvite recovery as reportable revenue | Chlorine dioxide + resource-recovery loop |
Frequently Asked Questions
What is the size of the global water reuse market in 2026?The global water reuse market is on track to exceed USD 50 billion by 2030, growing at roughly 9–11% CAGR, with industrial reuse capturing the larger share of new capacity commissioned in 2026 (BlueTech Research, 2025-11).
Which regulations are forcing industrial CAPEX on water reuse in 2026?The EU UWWTD recast (qu