Why Petrochemical Wastewater Is the Hardest Discharge to Get Right
Petrochemical wastewater is not one effluent — it is the blended discharge of crude distillation, catalytic cracking, ethylene cracking, and aromatics recovery, and its pollutant profile changes by the hour. The five signature contaminant classes are free and emulsified oil (often 200–2,000 mg/L upstream of any separator), refractory COD from phenols and polyaromatic hydrocarbons (typically 500–1,500 mg/L), high ammonia (200–800 mg/L NH₃-N in catalytic cracker overhead condensates), sulfide (5–50 mg/L depending on desulfurizer upsets), and trace heavy metals (Ni, V, Hg at ppb levels). Refinery wastewater can swing from 300 to 1,200 mg/L COD in a single day depending on which unit is in turnaround, and salinity from sour-water stripping can climb past 8,000 mg/L Cl⁻ — enough to inhibit unacclimated biomass.
The toxicity of that matrix is what makes membrane bioreactors (MBR) the default polishing step. The Qin et al. (2007) study in Journal of Membrane Science was the first to demonstrate that submerged MBR could hold steady effluent quality on petrochemical influent at mixed liquor suspended solids (MLSS) above 8,000 mg/L — concentrations that would crush a conventional clarifier. Almost two decades later, the same physics still defines the envelope: the membrane decouples biomass retention from hydraulic retention, and that decoupling is what lets a refinery run biological treatment at the toxicity levels its upstream units produce.
Treatment cost is rarely the binding constraint — the discharge limit is. In 2025, a Shandong province petrochemical park was assessed a 5M RMB administrative penalty after its COD discharge hit 187 mg/L against the GB 31573 direct-discharge cap of 50 mg/L, triggered by a stuck sampling probe that masked a biological-stage crash for 11 days. The lesson for specifiers: design the train to hold the number under upset, not just hit it on the average day.
Petrochemical Wastewater Discharge Limits by Jurisdiction (2026 Update)
No single global standard exists. A multi-site compliance manager must reconcile China GB 31573-2015, US EPA 40 CFR Part 419, EU BREF LVOC/refinery BAT-AEL, and India CPCB Schedule VI — and the numbers do not agree. The table below is the working reference for 2026 procurement.
| Parameter | China GB 31573-2015 (direct discharge) | China GB 31573-2015 (indirect, to sewer) | US EPA 40 CFR Part 419 Subpart F | EU BREF LVOC / Refinery BAT-AEL | India CPCB Schedule VI |
|---|---|---|---|---|---|
| COD (mg/L) | 50 | 500 (negotiated with WWT) | N/A as daily max; BOD₅ is the proxy | 50–80 (BAT-AEL range) | 250 |
| BOD₅ (mg/L) | 10 | 300 | 28 (30-day avg) | — | 100 |
| TSS (mg/L) | — | 400 | 20 (30-day avg) | 5–15 | 100 |
| Total nitrogen (mg/L) | 15 | 50 | — (refinery subcategory) | 5–15 | — |
| Total phosphorus (mg/L) | 0.5 | — | — | 0.5–2.0 | — |
| Petroleum oil (mg/L) | 1.0 | 20 | 10 (oil & grease) | 0.1–2.0 | 10 |
| Sulfide (mg/L) | 0.5 | 1.0 | — | 0.1–1.0 | 2.0 |
| Phenols (mg/L) | 0.5 | — | — | 0.1–0.5 | 1.0 |
| pH | 6–9 | 6–9 | 6–9 | — | 6.5–8.5 |
For Taiwan petrochemical projects, the Taiwan EPA effluent standard (ROC) imposes a 20 mg/L COD limit for non-high-nitrogen processes discharging outside source-water protection zones (enforced 2012-07-01) and 150 mg/L for high-nitrogen processes (enforced 2014-12-31), measured as the relevant water quality items in the attached table of that standard. The 2024–2026 trend is uniform tightening: China expanded GB 31573 to 21 monitored pollutant factors during the 2025 revision cycle, the EU Industrial Emissions Directive 2024 amendment is moving BAT-AEL ranges downward, and ESG-linked financing is making 30–50% water reuse a contractual requirement rather than a target. Buyers specifying in 2026 should size biological and polishing stages with a 20% design margin against the next tightening cycle.
Anatomy of a Compliant Treatment Train
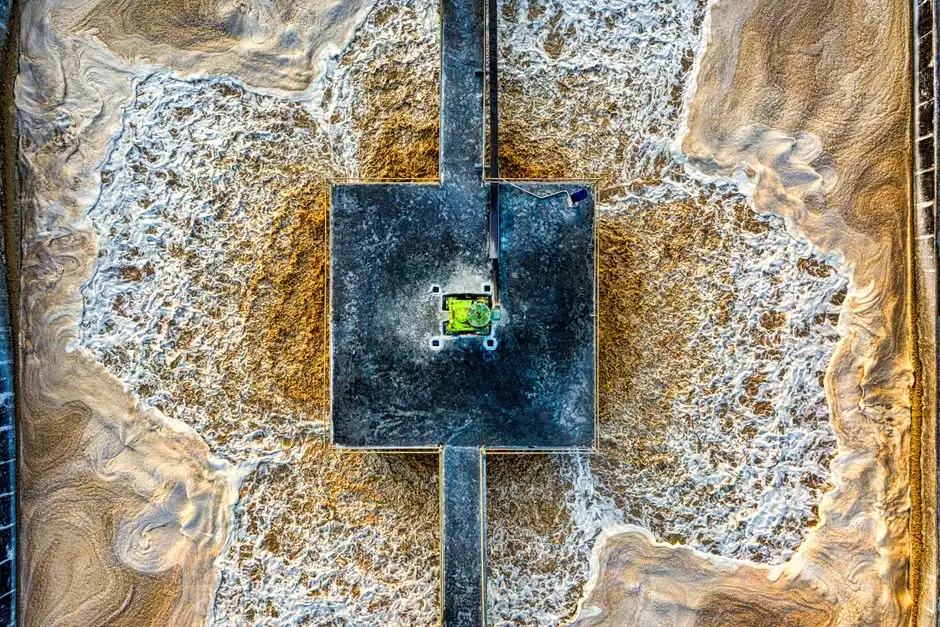
A train that meets the strictest 2026 limit — China's direct-discharge 50 mg/L COD plus 15 mg/L TN — runs five stages. The reader can paste this sequence into a P&ID and assign equipment to each block.
Stage 1 — Oil removal. An API or CPI separator followed by a DAF (dissolved air flotation) system takes influent oil from 200–2,000 mg/L to below 20 mg/L. Operate at an air-to-solids (A/S) ratio of 0.02–0.05 and dose 2–5 mg/L cationic polymer to break the emulsified fraction. Skim frequency is the single most common operational fault — automatic skimming is non-negotiable above 50 m³/h.
Stage 2 — Equalization and chemical dosing. A 24-hour surge basin absorbs the daily swings documented in the prior section. Hold pH at 7.0–8.5 using an automatic chemical dosing skid with ±0.1 pH control, dose phosphorus as a biological nutrient (the petrochemical C:N:P ratio runs around 500:25:1, so makeup P is essential), and apply anti-foam on aerated surfaces where surfactant carryover occurs.
Stage 3 — Primary biological. Use A/O (anoxic + aerobic) if nitrogen is in the permit, or A²/O (anaerobic + anoxic + aerobic) if total phosphorus is also limited. Typical performance: COD 800 → 100 mg/L, NH₃-N 200 → 15 mg/L at hydraulic retention 18–36 h. Petrochem influent toxicity demands sludge retention time (SRT) of 25–40 days, not the 5–10 days typical of municipal plants.
Stage 4 — MBR polishing. An integrated MBR membrane bioreactor delivers the consistent effluent that downstream limits demand. Run submerged PVDF flat-sheet modules at 0.1 μm pore, MLSS 8,000–12,000 mg/L, flux 12–18 L/m²·h. Effluent TSS typically drops below 1 mg/L and turbidity below 0.5 NTU — well within any 2026 limit and a strong reuse feed. The Qin 2007 precedent still defines the safe operating envelope.
Stage 5 — Advanced oxidation and carbon polishing. Ozone (O₃), ozone/peroxide (O₃/H₂O₂), or Fenton oxidation closes the residual COD gap from 80–100 mg/L to below 50 mg/L for the strictest Chinese standards. A downstream granular activated carbon (GAC) polisher removes trace organics that survive oxidation and is the single most effective step for reducing effluent toxicity units (TU) to below 1.0.
Equipment Selection, Process Parameters, and Real 2026 Costs
The numbers below come from a 50 m³/h (1,200 m³/day) refinery upgrade — a representative mid-scale project for a single process unit or a small ethylene plant. They are defensible for board-level capital review, but every site must adjust for influent profile, discharge mode (direct vs. sewer), and local construction cost.
| Stage | Equipment | Capacity range | Key parameters | Indicative 2026 price (USD) |
|---|---|---|---|---|
| 1 — Oil removal | DAF unit (DAF-A100 class) | 4–300 m³/h (13 standard models) | A/S ratio 0.02–0.05; polymer dose 2–5 mg/L; auto-skim | 85,000–120,000 |
| 2 — Equalization / dosing | Surge basin + automatic chemical dosing skid | 24 h HRT | pH ±0.1; P-dosing 5–10 mg/L; anti-foam on demand | 45,000–65,000 |
| 3 — Biological | A/O or A²/O basin + blower / decanter | Sized to 18–36 h HRT | MLSS 3,000–5,000 mg/L; SRT 25–40 d; DO 2.0–3.0 mg/L | 320,000–450,000 |
| 4 — MBR | Submerged PVDF flat-sheet MBR module in concrete or skid tank | 10–2,000 m³/day per skid | 0.1 μm pore; flux 12–18 L/m²·h; ~60% footprint vs. CAS + clarifier | 380,000–520,000 |
| 4b — Sludge handling | Plate and frame filter press for biological sludge | 1 m² filtration area per 8–10 m³/h of bio-sludge | Cake dryness 22–28% DS; cycle 90–120 min | 55,000–90,000 |
| 5 — Advanced oxidation + GAC | O₃ or O₃/H₂O₂ reactor + GAC contactor | O₃ dose 50–150 mg/L; GAC EBCT 15–30 min | COD 100 → <50 mg/L; TU <1.0 downstream | 420,000–680,000 |
CAPEX envelope for a 50 m³/h upgrade in 2026: USD 280K for a DAF-only upgrade to hit the oil limit; USD 1.2M for full A/O + MBR to meet effluent COD ≤50 mg/L; USD 1.9M if the project also adds advanced oxidation and zero-liquid-discharge (ZLD) polishing to satisfy a Class IV surface water protection zone. Civil works, instrumentation, and installation typically add 25–40% on top of equipment cost.
OPEX envelope: USD 0.18–0.42 per m³ treated, dominated by electricity (~60%, mainly aeration and recirculation pumps), sludge hauling (~20%, scaled to cake production), membrane replacement (~10%, on a 5–8 year cycle for PVDF), and chemical dosing (~10%). Sites that target water reuse recover 30–60% of OPEX through reduced raw-water purchase — a number that matters when ESG-linked financing starts pricing reuse into the loan covenant.
2026 Compliance Outlook: What's Changing and How to Get Ahead of It
Three forces are reshaping the 2026 envelope. First, China is moving toward Class IV surface water protection zones that will require total nitrogen ≤10 mg/L by 2027 — biological basins designed today at 15 mg/L effluent TN need the SRT and internal recycle capacity to push lower without a second retrofit. Second, the EU Industrial Emissions Directive 2024 amendment is tightening the LVOC and refinery BREF BAT-AEL ranges; expect a new COD <40 mg/L trigger value by 2027 that will push advanced oxidation from optional to baseline for direct-discharge sites. Third, ESG-linked financing is converting 30–50% water reuse from an aspirational KPI into a contractual covenant — the same MBR that meets the discharge limit is the reuse asset, and specifiers should size membrane surface area for the reuse peak day, not the discharge average.
The procurement strategy that survives all three: design the biological stage to the 2027 number, not the 2026 number; build the MBR with at least 20% spare module slots; and run advanced oxidation on a demand basis, not continuously, so the energy bill scales with the actual pollution load rather than the permit ceiling.
Frequently Asked Questions
What is the COD discharge limit for petrochemical wastewater in China in 2026?
China GB 31573-2015 caps direct-discharge COD at 50 mg/L, with total nitrogen limited to 15 mg/L and petroleum oil limited to 1.0 mg/L. The 2025 revision expanded the standard to 21 monitored pollutant factors.
What is the US EPA limit for refinery wastewater under 40 CFR Part 419?
Subpart F (petroleum refining) limits BOD₅ to 28 mg/L (30-day average), TSS to 20 mg/L, and oil & grease to 10 mg/L for direct discharge, per 40 CFR Part 419.
How does the EU BAT-AEL compare to GB 31573 for COD?
The EU BREF LVOC and refinery BAT-AEL set COD at 50–80 mg/L as the BAT-associated emission range — comparable in stringency to GB 31573, but expressed as a range rather than a single number and benchmarked against Best Available Techniques reference documents.
Which treatment stages are required to hit a 50 mg/L COD limit?
DAF oil removal, A/O or A²/O biological treatment, MBR polishing, and advanced oxidation (O₃ or O₃/H₂O₂) followed by GAC — five stages in series, sized at 18–36 h biological HRT and MBR flux of 12–18 L/m²·h.
What does a 50 m³/h petrochemical wastewater upgrade cost in 2026?
DAF-only: USD 280K; full A/O + MBR: USD 1.2M; with advanced oxidation and ZLD polishing: USD 1.9M. OPEX runs USD 0.18–0.42 per m³ treated, dominated by aeration electricity and sludge hauling.
For the full process flow, equipment specifications, and reuse design basis, see the Petrochemical Wastewater Treatment Solution blueprint and the broader Industrial Wastewater Treatment Market Trends 2026 brief. For fluoride-bearing refinery streams specifically, the Fluoride Discharge Standard 2026 guide covers limits and treatment separately.