Why 2026 Is a Pivotal Year for Paper Mill Wastewater Reuse
Three regulatory drivers converge in 2026 to make wastewater reuse a board-level decision for every pulp and paper operator. First, the US EPA Effluent Limitations Guidelines under 40 CFR Part 430 continue tightening BAT limits for bleached kraft and paperboard subcategories, with the 2024 Multi-Sector General Permit (MSGP) adding mandatory PFAS analytical monitoring for mills processing coated or laminated recycling streams. Second, the EU Industrial Emissions Directive 2010/75/EU and BAT Conclusions 2014/687/EU (BREF PPM) lock in BAT-AELs for COD (20–30 kg/ADt), AOX (≤0.5 kg/ADt for bleached kraft), and total suspended solids, with the 2026 review cycle putting existing installations on the clock to demonstrate compliance or face Article 11 enforcement. Third, China's GB 3544-2008 was amended in 2024 to tighten color (≤25 Pt-Co for waste-based mills) and AOX discharge limits, a move that ripples through global supply chains because mills exporting to Chinese converters must now meet these ceilings on-site.
Sludge economics sharpen the case. Per the Springer analysis of US papermill residuals (Erich & First, 1997), 56% of US paper mill sludge is combined primary and secondary solids — a baseline that any reuse-driven volume reduction strategy must address. Closing process loops upstream of biological treatment cuts the biological load entering activated sludge, directly shrinking that combined-sludge fraction and the landfill tonnage it represents. With freshwater tariffs rising 8–15% year-over-year in water-stressed basins (HydropureWater field data, 2025-2026) and biogas-to-boiler offsets now reliably worth $0.20–0.28/kWh, the 2026 payback math has crossed the threshold from marginal to defensible.
2026 Compliance Limits: EPA, EU and China Side by Side
The fastest way to ground a mill-specific compliance plan is to stack the three frameworks into a single extractable table. The values below reflect BAT or limit-of-technology numbers a procurement team can present directly to a regulator; the engineering trade-offs come in the next section.
| Parameter | EPA 40 CFR Part 430 (BAT, bleached kraft) | EU IED BREF PPM BAT-AEL | China GB 3544-2008 (amended 2024) |
|---|---|---|---|
| COD | ~1.5–2.5 kg/ADt (BAT) | 20–30 kg/ADt (daily/annual AEL) | ≤80 mg/L (existing mills); ≤50 mg/L (waste-based, 2024 amend.) |
| BOD5 | ~0.3–0.6 kg/ADt | <20 mg/L (treated effluent) | ≤20 mg/L |
| TSS | ~0.4–0.8 kg/ADt | <30 mg/L (treated effluent) | ≤30 mg/L |
| AOX | ≤0.13 kg/ADt (BAT) for bleached kraft | ≤0.5 kg/ADt (bleached kraft) | ≤8 mg/L; ≤5 mg/L (waste-based, 2024 amend.) |
| Total residual chlorine | ≤0.002 mg/L (BAT) | ≤0.2 mg/L (TRC as Cl2) | ≤0.5 mg/L |
| Color | Not numerically specified | BAT-associated level (site-dependent) | ≤25 Pt-Co (waste-based mills, 2024) |
| pH | 6.0–9.0 | 6.5–9.0 | 6.0–9.0 |
Two non-discharge parameters dominate the reuse conversation. Boiler-feed water at >40 bar typically requires chloride <50 mg/L, silica <0.7 mg/L, and conductivity <0.3 µS/cm to prevent turbine scaling and corrosion. The 2024 EPA MSGP also added quarterly PFAS monitoring for mills taking coated or laminated paper recycling streams, where fluorinated sizing agents and grease-barrier coatings can mobilize PFAS into the wastewater train. For sites handling persistent foaming or hot-spot PFAS detections, ion exchange or granular activated carbon polishing ahead of MBR or RO is now a defensible engineering choice. For related heavy-metal limits that often appear in the same compliance audit, see the heavy metal discharge compliance in 2026 reference guide.
The 2026 Reuse-Compliant Treatment Train: Unit Operations Mapped to Parameters
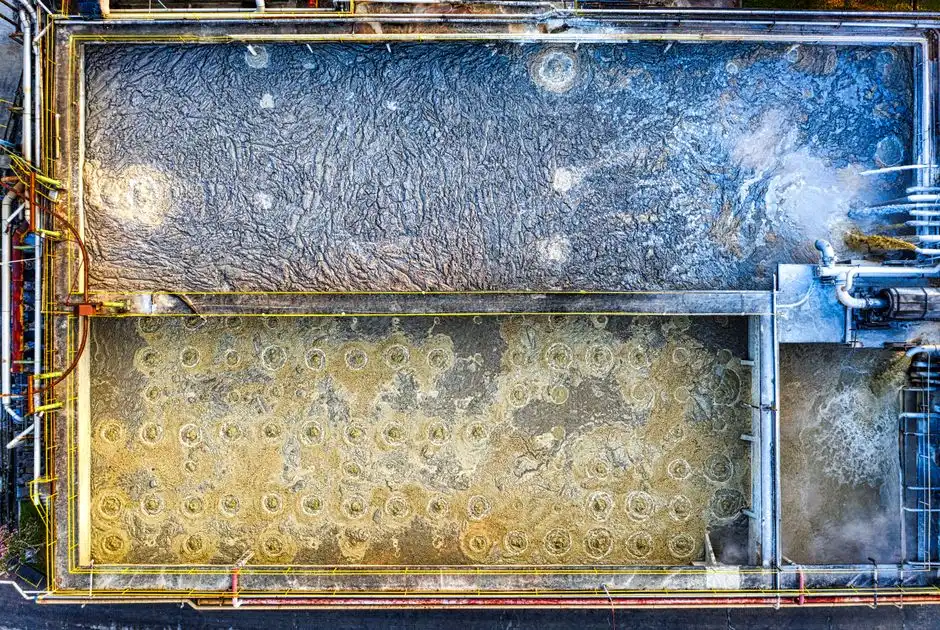
A defensible 2026 train runs in six steps, each tied to one or more compliance parameters. Selecting equipment within each step is where the mill-specific tuning happens.
- Primary clarification / fiber recovery. Rotary bar screens (typically 0.5–1.0 mm aperture) on the raw influent recover 5–20 kg of marketable fiber per ADt and protect downstream pumps from rag and grit. This is the cheapest contaminant removal step in the entire train.
- Dissolved Air Flotation (DAF). A Dissolved Air Flotation (DAF) system for paper mill primary treatment achieves 80–95% TSS removal and 60–85% FOG removal via 20–80 µm micro-bubbles. For pulp and paper effluent, DAF outperforms lamella plates on stickies, waxes, and ink-derived FOG that would otherwise blind a sedimentation basin. Hydraulic residence time of 20–40 minutes and air-to-solids ratios of 0.02–0.05 are typical design targets.
- Biological treatment. High-strength COD (often 1,500–4,000 mg/L after DAF) is reduced first in a UASB or internal-circulation anaerobic reactor at 35–37 °C with 8–15 kg COD/m³·day OLR, generating biogas (60–70% CH4). Polishing in an aerobic activated-sludge or sequencing batch reactor drops residual COD to <200 mg/L and achieves partial nitrification. The Fluence Consorzio Cartiere di Tivoli reference (Italy) couples this stage to a waste-to-energy boiler fueled by the biogas, displacing 8,000 kW/day of purchased energy.
- MBR / tertiary filtration. An MBR system for pulp and paper wastewater polishing with PVDF flat-sheet or hollow-fiber membranes (0.03–0.1 µm nominal) delivers TSS <1 mg/L, turbidity <1 NTU, and SDI <3 — the feed quality an RO system needs. MBR flux typically runs 15–25 L/m²·h at 0.1–0.4 bar TMP, with chemical cleaning every 3–9 months.
- Disinfection. A chlorine dioxide generator for effluent disinfection at 0.5–2.0 mg/L ClO2 residual achieves >99.9% microbial kill and partial color reduction without forming AOX — the critical advantage over Cl2 gas, which can re-introduce adsorbable organic halides and undermine the very compliance parameter you just fought to control.
- Reuse polishing. For boiler or cooling-tower makeup, an industrial RO system for boiler-feed reuse brings TDS to <50 mg/L and chloride to <10 mg/L. Two-pass RO with brackish-water elements is the typical configuration for high-pressure boilers; a CIP cycle every 4–12 weeks is normal.
| Unit operation | Primary parameter targeted | Typical removal / output | Reuse stage it enables |
|---|---|---|---|
| Rotary bar screen (GX series) | Fiber, grit, rags | 5–20 kg fiber/ADt recovered | All |
| DAF | TSS, FOG, color (partial) | 80–95% TSS, 60–85% FOG | Pre-biological |
| Anaerobic (UASB/IC) | High-strength COD | 60–80% COD; biogas 0.30–0.45 m³/kg COD removed | Pre-aerobic |
| Aerobic (AS/SBR) | Residual COD, NH3-N | COD <200 mg/L; partial nitrification | Pre-MBR |
| MBR | TSS, turbidity, partial color | TSS <1 mg/L, SDI <3 | Pre-RO / in-process |
| ClO2 disinfection | Microbial, residual color | >99.9% kill, no AOX formation | Discharge / in-process |
| RO | TDS, chloride, silica | >95% salt rejection | Boiler, cooling, ZLD feed |
Reuse Endpoints: Process Water, Boiler Feed, or Zero Liquid Discharge
The unit operations above do not have a single reuse outcome — they produce different qualities of water for different purposes, and matching the train to the endpoint is where capital is either saved or wasted.
- Tier 1 — In-process reuse (washing, dilution, showers). A DAF + biological + MBR train at Tier 1 typically achieves 50–80% freshwater reduction (Fluence BREF-compliant mill references), with quality suitable for non-contact applications. Salt balance is the limit: a mill running 80% reuse on a hard-water influent will see chloride climb roughly 4–5× per pass and needs a controlled blowdown to stay below 250–500 mg/L chloride in process water.
- Tier 2 — Boiler feed or cooling-tower makeup. Adding RO drops TDS, chloride, and silica to boiler-grade. For mills near saltwater-intrusion zones, RO permeate can also be used to recharge the underlying aquifer, with the concentrate sent to a cooling-tower blowdown line or a brine concentrator.
- Tier 3 — Zero Liquid Discharge (ZLD). A brine concentrator (mechanical vapor recompression or thermal) followed by a crystallizer produces dry solids for landfill or sale. ZLD becomes economic when freshwater cost exceeds $5/m³, when regulatory effluent is constrained, or when a mill's net-zero water commitment requires a closed mass balance. Above 30–50% reuse, salt balance is the binding constraint — not organics — which is why ZLD is fundamentally a salt-management problem, not a COD problem.
2026 Cost Benchmarks: CAPEX, OPEX and ROI for Compliance Upgrades
The table below aggregates planning estimates (industry-typical 2024–2025 ranges, ZLD-clarified). They are appropriate for feasibility study envelopes, not for fixed-price bid evaluation.
| Unit operation | CAPEX (USD per m³/day capacity) | OPEX (USD per m³ treated) | Energy share of OPEX |
|---|---|---|---|
| DAF | $15–40 | $0.04–0.10 | 30–50% |
| MBR (DF series) | $60–120 | $0.15–0.30 | 40–60% |
| RO (BW or brackish) | $40–90 | $0.20–0.45 | 55–70% |
| Full train (civil + equipment) | $150–300 | $0.35–0.70 | 40–60% |
| ZLD add-on (brine + crystallizer) | +$200–500 | +$0.60–1.50 | 70–85% |
Three revenue offsets commonly appear in the ROI calculation. Biogas-to-boiler at the Consorzio Cartiere di Tivoli scale of 8,000 kW/day is worth roughly $2,000/day at $0.25/kWh — about $730,000/year. Fiber recovery at the bar screen (5–20 kg/ADt at $50–150/tonne) covers 6–18 months of O&M in many cases. Freshwater cost avoidance at $0.50–2.00/m³ across 50–80% reuse of a 20,000 m³/day mill saves $1.8–5.8 million per year. The combined effect yields a simple payback of 3–6 years for a mill moving from discharge to in-process reuse with biogas recovery, consistent with the circular water economy strategies for industrial plants benchmarks.
Monitoring, Automation and Documentation for 2026 Audits
Equipment alone does not pass a 2026 audit — the data layer does. A reuse-compliant mill needs continuous online monitoring of flow, pH, conductivity, temperature, TSS, and COD or TOC at the biological effluent and MBR permeate, plus online color and residual ClO2 at the disinfection outlet. Lab AOX is required at the frequencies defined in the mill's discharge permit (typically monthly to quarterly), and quarterly PFAS analysis is now triggered automatically under the 2024 EPA MSGP for any mill taking coated or laminated paper recycling streams. DAF polymer and PAC dosing, plus antifoam control on the aerobic basin, is best handled by an automatic chemical dosing for DAF and biological stages system tied into the main PLC. A cloud monitoring for compliance self-reporting layer that timestamps every parameter and alarm is the most cost-effective way to satisfy EPA, EU, and MEE China self-monitoring report requirements without a paper chase during an inspection.
Frequently Asked Questions
Why is chlorine dioxide preferred over chlorine gas for paper mill disinfection? ClO2 oxidizes without chlorinating: at 0.5–2.0 mg/L residual it achieves >99.9% microbial kill and partial color reduction while leaving AOX unchanged, whereas Cl2 gas at the same residual can re-introduce 0.2–0.5 mg/L AOX and push a mill back above the EU BREF BAT-AEL of 0.5 kg/ADt for bleached kraft. See the chlorine dioxide generator for effluent disinfection for typical sizing data.
What percentage of freshwater can a typical pulp and paper mill realistically displace with reuse? EU BREF-compliant mills report 50–80% freshwater reduction at Tier 1, with closed loops in washing and showers. The hard ceiling is salt balance: chloride and hardness concentrate by 4–5× per pass, forcing a 20–50% blowdown that defines the upper reuse limit before RO or ZLD is added.
When does Zero Liquid Discharge actually make economic sense for a paper mill? ZLD is defensible when freshwater unit cost exceeds $5/m³, when the receiving watershed is fully allocated, or when corporate net-zero water targets require a closed balance. Below those thresholds, RO plus controlled blowdown delivers 90–95% of the water benefit at 25–40% of the ZLD CAPEX and OPEX.
What is the current 2024–2026 EPA position on PFAS in paper mill wastewater? The 2024 EPA Multi-Sector General Permit added mandatory analytical monitoring for PFAS, with quarterly sampling required at mills processing coated, laminated, or grease-barrier paper recycling streams. There is no numeric effluent limit yet, but the data is being collected to underpin a future ELG revision, so a 2026 baseline is now an audit artifact — not an option. For related 2026 heavy-metal limits, see the heavy metal discharge compliance in 2026 reference.