What Drives Ozone Oxidation Operating Cost in 2026
Typical ozone oxidation operating cost in 2026 is $0.45–$1.20 per m3 of treated wastewater. Electricity takes 55–70% of OPEX and oxygen feed takes 10–20%. At 8–14 kWh per kg O3, a 5 kg O3/h system treating 1,000 m3/day usually spends $95,000–$190,000 per year before labor and consumables.
Seven recurring line items dominate the stack, listed here in typical share order. They are electricity for the corona discharge generator and feed-gas compression; oxygen or feed-gas supply; cooling water; dielectric and electrode replacement; off-gas destruction catalyst and energy; preventive maintenance labor; and analytical consumables. Analytical items cover gas-phase O3 sensors, dissolved-ozone probe membranes, and reagent-grade calibration gas. Per Pawłowski's 2024 DBD optimization paper and BOC/Linde industrial bulletins cited in field audits, energy is 55–70% of 2026 OPEX. Oxygen is 10–20%, labor 6–10%, consumables and maintenance 8–15%, and the residual 2–5% covers catalyst turnover and instrumentation drift.
OPEX is always reported in $/kg O3 produced or $/m3 treated, never per hour. The dose (g O3/m3) is the engineering multiplier that scales any vendor quote to your flow and contaminant loading. CAPEX — the ozone generator, contactor/venturi skid, and destruct unit — is a separate one-time line that finance amortizes over 10–15 years. OPEX is the figure a plant manager benchmarks year over year and the recurring budget a CFO signs. Treat the columns as different conversations: CAPEX buys the hardware; OPEX pays for every kilogram of hydroxyl-radical equivalent delivered to the wastewater.
Energy Cost: The 55–70% Driver
Medium-frequency corona discharge generators in 2026 deliver 8–14 kWh per kg O3 produced at 6–12 wt% gas-phase concentration. The best industrial units from BOC, Wedeco (Xylem), and OzoneTech cluster at 9–11 kWh/kg per Pawłowski 2024 DBD optimization (ResearchGate citation #16). Specific energy rises sharply below 1 kg O3/h because small reactors lose thermal efficiency. Lab and pilot units can hit 18–25 kWh/kg O3, so air-fed bench systems are a poor proxy for plant economics.
Worked example for a 5 kg O3/h system: 5 kg/h × 10 kWh/kg × $0.09/kWh × 6,000 operating hours per year = $27,000/year just for ozone generation. Add 8–12% for the dissolution side — sidestream pump, booster pump, venturi ejector, and any recirculation loop. Ozone-related electricity then lands near $29,000–$30,000/year before site pumping or feed-gas heating/cooling. At European industrial tariffs of $0.14–$0.22/kWh, that same 5 kg/h unit runs $45,000–$60,000/year on electricity alone. Every serious cost model starts with the local kWh price, not a U.S. average.
Ozone generation saturates at high discharge power density. The Pawłowski paper shows that pushing the dielectric past its design point raises specific energy without a matching rise in O3 output. The extra wattage goes into heat and nitrogen oxides. Vendors that quote "higher yield at higher power" are usually quoting a transient peak, not a steady-state duty point. Most plants we size for 2–10 kg O3/h pin kWh/kg to a published concentration and feed-gas specification before they sign.
What Does an Industrial Ozone Generator Cost to Run?
Industrial ozone generator water-treatment run cost is dominated by specific energy, feed-gas choice, and annual operating hours, not the nameplate kg O3/h alone. At 8–14 kWh/kg O3 and $0.09/kWh, generation power alone is about $0.72–$1.26 per kg O3 before dissolution pumps and destruct power. Scale that by dose (g O3/m3) and daily flow to get a plant-level $/m3 figure that procurement can compare across bids.
A compact Ozone Generator & Water Tank Sterilization System on tank or sidestream duty still follows the same energy math, though absolute annual dollars are lower at sub-1 kg O3/h. Air-fed units at that scale often sit at 16–22 kWh/kg O3, so the $/kg O3 figure looks worse even when the absolute bill is small. Ask every bidder for kWh/kg at your design outlet concentration, feed-gas purity, and cooling-water temperature. Those three conditions move quotes more than brand names.
Oxygen Feed Gas: Air vs PSA vs VPSA vs LOX
Feed-gas selection is the second-largest OPEX lever. Buyers often default to air-feed because the CAPEX line is lower. In practice, the choice can swing total OPEX by 18–30% on a 2–10 kg O3/h system. Air-fed corona discharge runs 16–22 kWh/kg O3. Roughly 80% of the discharge gas is nitrogen that consumes energy without producing ozone. Air feed is also limited to 3–5 wt% outlet concentration, which forces larger contactors. PSA oxygen (90–93% purity) drops generator specific energy to 9–13 kWh/kg O3 but adds $0.10–$0.18/m3 of O2 supplied. VPSA (vacuum-swing adsorption) hits the best economics in the 2–20 kg O3/h range. VPSA typically shows ROI under 2 years vs. air feed once electricity exceeds $0.08/kWh. LOX (bulk liquid oxygen, 99.5%+) only becomes competitive above 20 kg O3/h on continuous duty because of boil-off losses and cylinder/tank rental.
Decision rule that holds across tariff regions: stay air-fed below 1 kg O3/h; evaluate PSA at 1–2 kg/h; specify VPSA from 2–20 kg/h; switch to LOX above 20 kg/h with on-site storage. The CAPEX premium on PSA cannot be amortized below 1 kg O3/h. The break-even shifts downward where electricity is above $0.12/kWh, and upward where waste heat is free.
| Feed Gas Option | Purity | Specific Energy (kWh/kg O3) | O2 Cost Adder | Best-Fit Capacity |
|---|---|---|---|---|
| Air (compressed/dry) | ~21% O2 | 16–22 | None (compressor power only) | < 1 kg O3/h |
| PSA (pressure-swing adsorption) | 90–93% | 9–13 | $0.10–$0.18/m3 O2 | 1–2 kg O3/h |
| VPSA (vacuum-swing adsorption) | 90–93% | 9–12 | $0.07–$0.14/m3 O2 | 2–20 kg O3/h |
| LOX (bulk liquid oxygen) | 99.5%+ | 8–10 | $0.05–$0.12/m3 O2 + rental | > 20 kg O3/h continuous |
Consumables, Maintenance & Off-Gas Destruction
Consumables, the destruct unit, and labor hours are the line items engineering often omits from the first estimate. Finance remembers them at year-end close. Dielectric tubes and electrodes in modern medium-frequency generators carry 18,000–30,000 hour service life. That life translates to $0.04–$0.09 per kg O3 produced at typical parts-and-labor pricing. Off-gas destruction is mandatory at most sites. Thermal-electric destruct units cost $0.03–$0.05 per kg O3 destroyed in electricity. Catalytic destructs run $0.02–$0.04 per kg but need catalyst replacement every 24–36 months. Catalyst swaps cost $1,800–$4,500 for a 1–5 kg/h system. Three standards govern whether the destruct is optional or compulsory: OSHA PEL 0.1 ppm 8-h TWA (29 CFR 1910.1000), EU IOELV 0.2 ppm (Directive 2017/164), and China GBZ 2.1. Exceeding any of these in the contactor vent headspace triggers mandatory destruction before vent.
Cooling water demand is set by the dielectric heat load: 0.5–1.5 m3/h per kg O3/h at 25–30 °C outlet temperature, per the Pawłowski benchmark. Closed-loop chillers add $0.01–$0.03 per kg O3 in chiller power. Analytical consumables run $400–$900 per dissolved-ozone probe membrane, replaced every 6–12 months. Annual gas-phase sensor cap replacement costs $200–$500. Preventive labor for a 1–5 kg O3/h system is 80–160 hours per year at $45–$80/h fully loaded. That labor covers dielectric inspection, PSA sieve checks, probe calibration, and destruct catalyst testing. Add an 8–15% contingency for unscheduled downtime and instrumentation drift. Vendors that quote 99% uptime in year one rarely hit it in year three.
How Do You Break Down Water Treatment Plant Costs?
Water treatment plant cost breakdown for an ozone train separates CAPEX from recurring OPEX. CAPEX covers the generator, contactor, destruct, and civil work. OPEX covers energy, oxygen, parts, labor, and analytics. Buyers who mix the two columns understate year-two cash needs and overstate first-year savings. A practical OPEX checklist for ozone oxidation operating cost reviews covers seven items. List local industrial kWh tariff, feed-gas route and O2 adder, design dose in g O3/m3, annual operating hours, dielectric and catalyst replacement cycle, destruct energy, and fully loaded maintenance hours.
For a 1,000 m3/day plant at 50 g O3/m3, annual ozone mass is about 16.5 t/year at 330 operating days. Multiply that mass by your verified $/kg O3 stack before you accept a vendor's $/m3 claim. Sites that already track membrane or chemical OPEX can reuse the same board-memo format used in the ultrafiltration system operating cost benchmarks and the wastewater chemical cost optimization tactics for 2026 guides.
OPEX Per Cubic Meter: How to Read Vendor Quotes
The single number a plant manager puts in a board memo is dollars per cubic meter treated. The 2026 benchmark range for industrial ozone oxidation is $0.45–$1.20 per m3 across a dose band of 20–80 g O3/m3. Every additional 10 g O3/m3 of dose adds roughly $0.10–$0.18/m3 at current electricity tariffs. The dose specification moves the number more than any downstream equipment choice. A pharmaceutical effluent at a 50 g O3/m3 dose lands at $0.65–$0.95/m3 OPEX in 2026. A textile dye bath at 70 g O3/m3 sits closer to $0.90–$1.15/m3.
Compare against the two most common alternatives at the same dose equivalent. Fenton oxidation runs $0.30–$0.55/m3 at 50–100 g H2O2/m3 but adds iron sludge disposal and pH conditioning. UV/H2O2 advanced oxidation runs $0.70–$1.40/m3 with lamp replacement every 8,000–14,000 hours. Read vendor quotes carefully. Some bundlers quote the $/m3 number at "design dose" while the operating dose at your real inlet COD will be 30–60% higher. That shift moves OPEX off the bottom of their range into the top half.
Ozone vs Fenton vs UV/H2O2: OPEX Comparison 2026
Ozone oxidation on a 1,000 m3/d effluent at a 50–70 g/m3 oxidant dose band lands at $0.45–$1.20/m3. It has no chemical logistics and no sludge, but high electricity exposure and skilled maintenance. Run the same flow head-to-head against Fenton and UV/H2O2 for a defensible internal benchmark. Fenton lands at $0.30–$0.55/m3 but generates 0.8–1.5 kg of iron sludge per kg H2O2 dosed. It also needs pH conditioning chemicals to hold the reactor at pH 3.0–3.5. UV/H2O2 lands at $0.70–$1.40/m3. Medium-pressure lamps need replacement every 8,000–14,000 hours at $200–$450 per lamp, plus quartz-sleeve cleaning 2–4 times per year.
Decision framework across pharma, chemical, textile, and electronics effluents starts with the contaminant, not the brochure. Ozone wins on refractory organics such as 1,4-dioxane, NDMA precursors, and sulfamethoxazole, and when chemical logistics or footprint are tight. Fenton wins on raw cost and on inlet variability. It tolerates 3:1 influent swings that would force an ozone system to throttle dose continuously. For solvent-heavy streams, cross-check the cost of fenton oxidation in wastewater treatment before locking the AOP path. UV/H2O2 wins on trace organics at low influent COD and where an off-gas train is impractical. For most chemical and pharmaceutical plants with refractory loads above 1,000 mg/L COD, ozone paired with a downstream MBR biological polishing downstream of ozone oxidation is the strongest 2026 configuration. Pre-ozone pH conditioning is typically handled by a PLC-controlled chemical dosing for pH conditioning before ozone contact.
| Parameter | Ozone (corona discharge) | Fenton | UV / H2O2 |
|---|---|---|---|
| 2026 OPEX ($/m3) | 0.45–1.20 | 0.30–0.55 | 0.70–1.40 |
| Typical dose | 20–80 g O3/m3 | 50–100 g H2O2/m3 | 10–30 g H2O2/m3 + UV |
| Sludge / by-product | None (gas-phase) | 0.8–1.5 kg iron sludge per kg H2O2 | None |
| pH requirement | Broad (6–9 typical) | 3.0–3.5 (acid conditioning) | 6–8 |
| Off-gas treatment | Destruct unit mandatory (OSHA 0.1 ppm) | None | None |
| Main consumable | Dielectric tubes, O2, electricity | 30–50% H2O2, FeSO4, H2SO4 | Lamps, H2O2, sleeve cleaning |
| Maintenance skill | High (electrical, instrumentation) | Low–medium | Medium (electrical, quartz handling) |
Worked Payback Example: COD Reduction at a 1,000 m3/day Chemical Plant
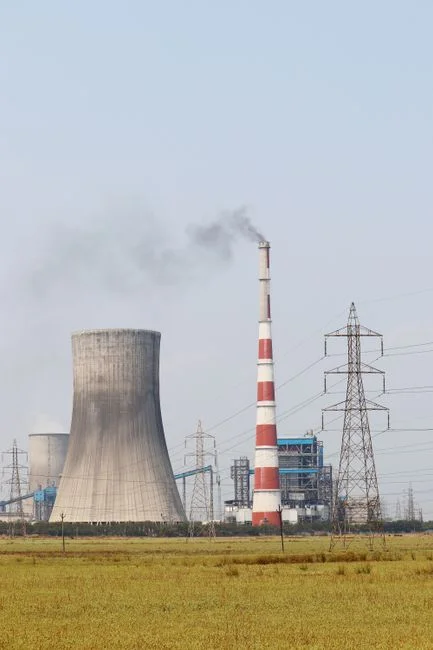
Scenario: 1,000 m3/day of chemical-plant effluent at 1,800 mg/L COD, discharge limit ≤ 300 mg/L. Ozone delivers 60% COD reduction at a 50 g O3/m3 dose. Annual ozone OPEX at $0.78/m3 × 1,000 m3/d × 330 operating days is about $257,000/year. The current Fenton baseline runs $0.42/m3 × 330,000 m3 = $139,000/year in hydrogen peroxide and iron salts. Iron sludge adds 220 t/year at $85/t disposal, or $19,000/year. pH swing chemicals (H2SO4 and NaOH) add about $28,000/year. The Fenton total is roughly $186,000/year.
Net delta: ozone carries about $71,000/year of additional OPEX. It eliminates iron sludge handling liability and removes the 28% H2O2 bulk-delivery dependency. It also meets a 2026 effluent color limit of < 50 Pt-Co that Fenton alone is marginal on. If the alternative capital path is a $400,000 biological-stage upgrade to meet the new color limit, ozone's OPEX premium pays that capital back in 5.6 years. It also removes the Fenton chemical-handling footprint from the plant.
Who This Is For / Next Step
Who this is for: plant engineers and EPC teams sizing corona-discharge ozone for refractory COD, color, or micropollutant limits at roughly 1–20 kg O3/h. Who should look elsewhere: sites below 1 kg O3/h with cheap air feed and no off-gas constraints, or plants whose primary driver is lowest chemical OPEX regardless of sludge. Next step: gather inlet COD, target dose, local kWh tariff, and preferred feed-gas route, then request a site-specific ozone OPEX and ROI estimate with the same line-item structure used above.
Frequently Asked Questions
What is the typical 2026 OPEX range for an industrial ozone oxidation system?
Industrial ozone oxidation runs $0.45–$1.20 per m3 of treated wastewater in 2026, with most sites clustering in the $0.65–$0.95/m3 band at a 50 g O3/m3 dose. Annual OPEX for a 5 kg O3/h system treating 1,000 m3/day falls between $95,000 and $190,000 before labor. Dose and local electricity tariff move the number more than generator brand.
Which line item dominates ozone OPEX?
Electricity is the dominant OPEX driver, accounting for 55–70% of the recurring cost. Specific energy at 8–14 kWh per kg O3 means a 5 kg/h unit drawing $0.09/kWh power spends about $27,000/year on ozone generation alone. Dissolution pumps and destruct add another 8–12% on many skids.
How do I choose between air, PSA, VPSA, and LOX feed gas?
Use air below 1 kg O3/h, evaluate PSA at 1–2 kg/h, specify VPSA from 2–20 kg/h, and switch to LOX above 20 kg/h on continuous duty. VPSA typically delivers ROI under 2 years against air feed once electricity exceeds $0.08/kWh. High-tariff European sites often break even at lower capacities.
Is ozone cheaper than Fenton or UV/H2O2 in 2026?
Fenton is the cheapest at $0.30–$0.55/m3, ozone is mid-range at $0.45–$1.20/m3, and UV/H2O2 is the most expensive at $0.70–$1.40/m3. Ozone wins on sludge-free operation, refractory organics, and footprint; Fenton wins on raw cost and inlet variability. Include sludge disposal when you compare Fenton on a total-cost basis.
Is an off-gas destruct unit always required?
Yes at any site where contactor vent concentrations could exceed OSHA PEL 0.1 ppm, EU IOELV 0.2 ppm, or China GBZ 2.1. Thermal destructs run $0.03–$0.05 per kg O3 destroyed; catalytic destructs run $0.02–$0.04 with catalyst replacement every 24–36 months. Budget catalyst swaps for 1–5 kg/h systems at $1,800–$4,500 each.