What 'Operating Cost' Actually Means for a Petrochemical WWTP in 2026
Operating cost (OPEX) for a petrochemical wastewater plant in 2026 is the sum of six line items charged to the utilities or environmental ledger: electrical energy, chemicals, sludge disposal, labor, maintenance/spares, and consumables such as membrane modules, filter media, and activated carbon — all expressed per cubic meter of treated effluent. It is reported per m³ rather than per kg COD removed because influent load swings 20–40% week-to-week at most refineries, and finance controllers want a single number that survives a feed-rate change without re-pricing the budget.
The most-cited recent baseline is Lyu et al. 2020, which modeled a Chinese chemical industrial park at 654 million CNY per year on 27 CNY per ton of wastewater, with the treatment step itself accounting for 28.6% of that figure — roughly 7.7 CNY/t of treatment-only cost, or about $1.10/m³ at a 7 CNY/USD reference rate. Once the full OPEX envelope (energy, sludge off-site, labor) is added, that single train lands closer to $3.50–$4.20/m³ for a petrochem-grade influent. The caveat: Lyu's influent is a mixed chemical-park blend, not a refinery-specific stream, so direct $ conversion to a U.S. or EU plant should add a 15–25% buffer for higher sludge-disposal tariffs and stricter discharge limits.
Two definitions engineers should keep separate: gross OPEX is the cost per m³ of influent entering the works; net OPEX subtracts the avoided cost of freshwater purchase and the credit for recovered oil or recycled cooling-tower makeup. On a 10,000 m³/day refinery, the net figure can run 10–20% below gross once cooling-tower reuse is in place, which is why every budget memo in 2026 should show both columns.
Petrochemical Wastewater Plant OPEX Breakdown: 2026 Benchmark Numbers
For a 10,000 m³/day refinery WWTP, the 2026 distribution of operating cost per m³ treated lands in a tight band that procurement can defend in a budget review. The single largest bucket is always electrical energy; the second varies between sludge and chemicals depending on whether the plant runs a biological or pure-physicochemical train.
| OPEX line item | Share of total OPEX | Indicative 2026 cost (USD/m³) | Indicative 2026 cost (CNY/m³) | Main cost drivers |
|---|---|---|---|---|
| Energy (electricity + fuel) | 35–55% | $0.30–$2.10 | 2.1–15.0 | Aeration blowers, transfer pumps, sludge dewatering |
| Sludge handling & disposal | 15–25% | $0.12–$1.05 | 0.9–7.5 | Dewatering, transport, hazardous-waste landfill gate fee |
| Chemicals (coagulants, polymers, NaOH, defoamer, nutrients) | 10–18% | $0.08–$0.76 | 0.6–5.4 | Dose rate, polymer cost, tertiary-polish chemistry |
| Labor (operators, lab, EHS) | 8–12% | $0.06–$0.50 | 0.5–3.6 | Shift coverage, automation level, regional wage |
| Membrane & media replacement | 5–10% | $0.04–$0.42 | 0.3–3.0 | MBR/RO membrane life, GAC turnover |
| Maintenance, spares, lab | 5–8% | $0.04–$0.34 | 0.3–2.4 | Pump rebuilds, instrument calibration, third-party analysis |
| Total | 100% | $0.80–$4.20 | 5.7–30.0 | — |
The sum-check matters: a plant running a fully biological MBR train with no RO polish should sit at the low end of energy and chemical spend, while a plant with carbon adsorption and advanced oxidation will sit at the top. Anything outside the 35–55% energy band is worth a second look — either the aeration system is oversized (and the OPEX is hiding in the wrong line) or the cost is being absorbed by an internal transfer and not reaching the WWTP budget at all.
On the consumables line, PVDF MBR modules typically last 5–8 years in oily service with proper relaxation cleaning; RO membranes 3–5 years depending on antiscalant program; and granular activated carbon 1–3 years before breakthrough on TOC. Engineering teams that budget a 7-year membrane life for MBR and 4-year for RO are usually within 5% of the actual annualized number (HydropureWater field data, 2026).
Where the Cost Actually Goes: Energy, Sludge, and Chemicals
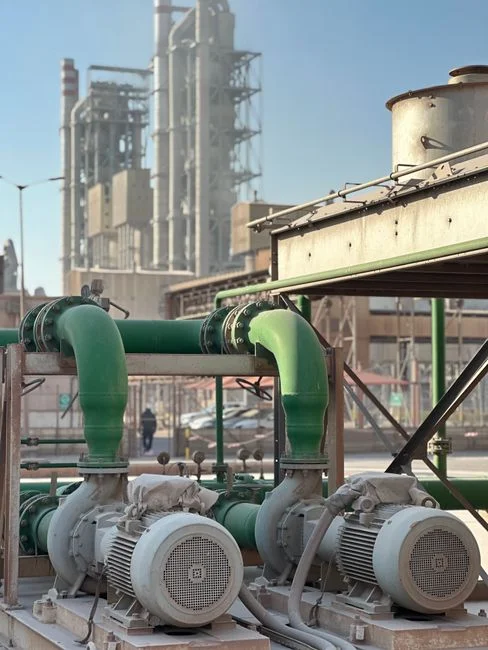
Energy is the bucket where one well-placed control loop returns the most money. Aeration blowers in a refinery activated-sludge or MBR tank draw 60–70% of the plant's total electrical load, and that load scales almost linearly with dissolved-oxygen setpoint. Holding DO at 1.5–2.5 mg/L in the aeration basin — instead of the legacy 3–4 mg/L — typically cuts blower kWh by 20–35% with no measurable loss in COD removal efficiency, because nitrification rates plateau above 2 mg/L in most petrochem streams.
The second lever is hardware: high-efficiency turbo blowers equipped with permanent-magnet motors and VFD control routinely deliver 20–30% electrical savings over multistage centrifugal units of the same age, with a 2–4 year payback at current industrial electricity tariffs ($0.07–$0.12/kWh in most U.S. and Chinese refining hubs). A HydropureWater dissolved air flotation system on the front end cuts the aeration-tank organic load by 40–60%, which lets the blower ride lower for longer — a compounding gain.
Sludge is the cost trap that most engineers underestimate until the first hazardous-waste invoice arrives. Oily sludge from DAF float plus waste-activated sludge from the biological stage both have to be dewatered, and the cake-solids number drives the entire disposal bill. A plate-and-frame filter press achieves 22–28% cake solids on refinery sludge; a screw press typically lands at 18–24%. That 4–6 point gap cuts hauling weight by roughly 20%, which is a direct hit on the disposal line. Disposal itself is a wild card: oily hazardous sludge can run $80–$200 per ton to landfill or incinerate in 2026, versus $30–$60 per ton for non-hazardous biosolids. The HydropureWater plate-and-frame filter press family covers 1–500 m² of filtration area and is the workhorse in most of the 10,000 m³/day plants we see.
Chemicals are the easiest line to attack with instrumentation. Tertiary-polish coagulant doses typically run 50–200 mg/L as FeCl₃ or PAC, and a streaming-current or zeta-potential controller holds the dose at the minimum required for target turbidity — usually 20–40% below the manual setpoint. Lamella clarifier geometry shortens the settling path and lets the same dose do more work, which is why the HydropureWater high-efficiency sedimentation tank is specified with the HydropureWater automatic chemical dosing skid on most greenfield builds.
Process-Route Comparison: Which Treatment Train Has the Lowest 2026 OPEX?
The cheapest train on paper is rarely the cheapest train once discharge limits, footprint, and reuse targets are priced in. The four realistic options for a 2026 refinery or petrochemical WWTP fall into the table below; all OPEX ranges are for a 5,000–20,000 m³/day feed at a single site, 2026 USD/m³.
| Train | Core unit operations | 2026 OPEX (USD/m³) | Footprint vs CAS | Effluent COD (mg/L) | Best fit |
|---|---|---|---|---|---|
| A — Conventional activated sludge | API/DAF → CAS → secondary clarifier → sand filter | $0.80–$1.50 | 1.0× (baseline) | 80–150 | Cost-only retrofits; sites with weak effluent limits or large land banks |
| B — DAF + MBR + RO | DAF → submerged MBR → cartridge → RO | $1.40–$2.80 | ~0.4× (per Qin et al., J Membr Sci 2007) | <30 (RO permeate) | 2026 default for greenfield, reuse, or sites discharging to sensitive receiving water |
| C — Electroflotation + bio + GAC | EF → biological → activated carbon polish | $2.50–$4.20 | ~0.7× | 40–80 | Small flows (<2,000 m³/day) with strict phenol or trace-organic limits |
| D — Pure physicochemical | Coagulation → DAF → sand → carbon | $1.80–$3.20 | ~0.5× | 100–160 | Not a real option for ammonia or dissolved organics; legacy only |
Train B is the 2026 default for any greenfield or major upgrade where the plant needs cooling-tower or boiler-feed reuse water, or where discharge limits are tightening to COD <60 mg/L. The HydropureWater integrated MBR system paired with the DF-series flat-sheet MBR module covers the biological step at 80–225 m² of membrane area per skid, and the HydropureWater RO system polishes to reuse spec. Train A still wins on pure dollar-per-m³ for cost-only retrofits where the receiving water is robust, but the gap to Train B narrows quickly once reuse credits are counted.
Train C — electroflotation plus biological plus activated carbon — is justified only for very small flows or sites with strict phenol limits where the electrolytic cell removes dispersed oil and phenolics that would otherwise poison an MBR. The reference is the Springer Clean Technologies and Environmental Policy paper on electrochemical treatment of petrochemical wastewater. Train D — pure physicochemical — fails on ammonia and dissolved organics at any modern discharge limit and is not a serious 2026 option outside legacy sites with grandfathered permits.
2026 Compliance Layer: How Discharge Standards Shift the OPEX Math
The "lowest OPEX" route is a moving target because the regulator decides where the line is. Three jurisdictions dominate the decision matrix for a multinational refining group, and each one moves the train selection by 1–2 unit operations.
In China, GB 31573-2015 sets COD ≤60 mg/L, ammonia ≤8 mg/L, and total nitrogen ≤40 mg/L for the petrochemical industry — limits that effectively force a biological stage plus tertiary polish. A plant discharging to a Class I watershed under GB 3838 faces an even tighter COD <30 mg/L bar, which is where RO enters the OPEX equation. In the U.S., EPA 40 CFR Part 419 governs the oil and gas / petrochemical subcategory, with BPT/BAT effluent limits typically COD ≤160 mg/L for existing sources and NSPS COD <100 mg/L for new sources — looser on paper, but many state permits (Texas, Louisiana, California) add toxicity and chloride caps that push plants back to advanced treatment. The EU Industrial Emissions Directive 2010/75/EU, through the Common Waste Water Treatment System BAT conclusions, sets BAT-AELs in the COD <30–125 mg/L range depending on the receiving water.
The cost premium of a tightening step is real and predictable: moving from COD 100 mg/L to 30 mg/L typically requires adding RO or advanced oxidation, which adds $0.30–$0.80/m³ of OPEX in 2026 dollars. That number is the right benchmark to use when a regulator floats a new draft limit.
5-Step OPEX Reduction Plan for 2026
Step 1 — Audit and automate aeration. Install DO-based blower control with online probes in the aeration basin; the typical saving is 15–25% of total electrical OPEX, with a 12–24 month payback on instrumentation and VFD upgrades. Hold DO at 1.5–2.5 mg/L and verify nitrification with online NH₃-N.
Step 2 — Recover float oil from DAF skimmings. A 10,000 m³/day refinery WWTP can recover 5–15 m³/day of oil from DAF float, worth $3,000–$9,000/day at 2026 crude pricing once routed back to a slop tank or re-refiner. The capex is a holding tank and a small heater; payback is often under 6 months.
Step 3 — Switch to high-efficiency turbo blowers and VFD-driven transfer pumps. Turbo blowers cut aeration energy 20–30% versus multistage centrifugal units; VFDs on transfer pumps recover another 10–20% on pump curves that have throttled down with system backpressure changes over the last decade. Combined payback is 2–4 years.
Step 4 — Optimize coagulant and polymer dose with online control. Streaming-current or zeta-potential-based dose control typically delivers 20–40% chemical savings with a 6–12 month payback, as detailed in the Wastewater Treatment Chemical Cost Optimization: 2026 Engineering Guide. Pair this with a HydropureWater automatic chemical dosing skid sized for the plant's peak flow.
Step 5 — Reuse polished effluent for cooling-tower makeup or scrubber feed. Reuse eliminates 30–60% of freshwater purchase on a typical refinery and reduces the discharge volume that drives the disposal line. Net saving is $0.20–$0.60/m³ after RO energy is netted, and the OPEX math rarely shows up negative unless the reuse water is too pure for the intended service.
Frequently Asked Questions
What is the typical operating cost per cubic meter for a petrochemical wastewater plant in 2026? Petrochemical wastewater plant operating cost in 2026 runs $0.80–$4.20/m³ (≈5.7–30 CNY/m³) depending on the treatment train, with biological MBR+RO trains at the upper end and conventional activated sludge at the lower end. The 35–55% energy share is the single biggest driver.
Which OPEX line item is the largest? Electrical energy is always the largest bucket at 35–55% of total OPEX, with aeration blowers alone drawing 60–70% of plant kWh. Sludge handling (15–25%) and chemicals (10–18%) are the second and third.
What is the lowest-OPEX process train for a 2026 greenfield refinery WWTP? DAF pre-treatment plus submerged MBR plus RO polish is the lowest-OPEX option for 2026 builds that need reuse-quality effluent or discharge to a sensitive receiving water, typically $1.40–$2.80/m³ net of reuse credits. Conventional activated sludge is cheaper per m³ but does not meet tier-1 discharge limits without tertiary polish.
How much does sludge disposal cost a refinery WWTP? Hazardous oily sludge disposal runs $80–$200 per ton in 2026, depending on region and incineration capacity. A 10,000 m³/day plant generating 8–15 tons/day of dewatered cake is a $250K–$1.1M annual line item before any optimization.
Do MBR and RO pay back in petrochemical service? Yes, when reuse credits and avoided freshwater purchase are counted. A DAF+MBR+RO train typically pays back the incremental capex over a conventional train in 3–5 years at 2026 industrial water tariffs, and the OPEX gap narrows to near parity once reuse is fully valued. For a deeper dive on adjacent membrane OPEX, see Ultrafiltration System Operating Cost in 2026: OPEX Breakdown & ROI and the SBR Plant Operating Cost Breakdown 2026: OPEX Drivers & Savings.