MBR vs SBR: Direct Engineering Answer
An MBR vs SBR wastewater treatment cost comparison turns on solids separation: 0.1–0.4 µm membranes versus gravity settling in batch cycles. MBR permeate runs below 1 mg/L TSS; SBR typically settles to 10–30 mg/L. MBR cuts footprint near 60% but needs more energy.
Both processes use suspended-growth biology on municipal and industrial wastewater. MBR couples aeration with membrane filtration. SBR completes treatment and clarification in one tank over a timed cycle. Selection turns on permit limits, land area, energy budget, and operator skill.
Why the Technology Choice Changes CAPEX and Compliance Risk
Choosing MBR or SBR changes long-term operating cost because MBR plants often need 60% less footprint but 0.5–1.0 times more energy than comparable SBR plants. A 500 m³/day dairy plant in Jiangsu faced a 30% tightening of BOD discharge limits. Existing production lines left no space for the large settling volume an SBR expansion would need. Management had to weigh MBR capital cost against compliance risk and the land cost of a larger SBR.
Compliance is usually the first driver. When reuse-quality solids limits apply, SBR settleability becomes a liability. When land is ample and energy is scarce, membrane scouring power can dominate OPEX. Key factors remain effluent quality, footprint, energy availability, CAPEX/OPEX balance, and onsite technical staffing. Teams that only need a high-level sbr and mbr difference overview should start there before locking CAPEX.
For a wider plant-scale view, the sibling guide MBR vs SBR: 2026 Side-by-Side Comparison for Industrial Wastewater tabulates the same selection trade-offs for EPC teams.
How MBR and SBR Work: Process Mechanisms and Key Parameters
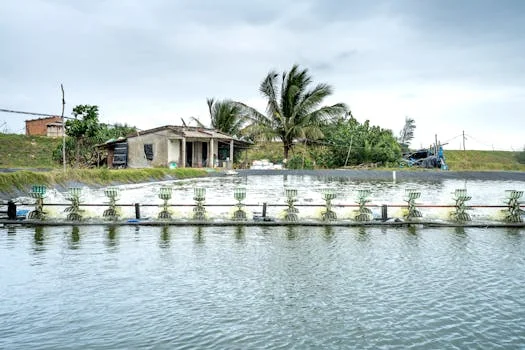
Solids-liquid separation defines the mechanical split: MBR uses a physical membrane barrier with 0.1–0.4 µm pores, whereas SBR depends on gravity-driven sedimentation in a temporal batch sequence. MBR combines biological degradation with membrane filtration, usually employing HydropureWater’s DF series MBR membrane modules for submerged applications. These PVDF or PE membranes typically run at Mixed Liquor Suspended Solids (MLSS) of 8,000 to 12,000 mg/L. Constant aeration scours the membrane surface and raises the energy profile. Most plants we size for food or chemical duty run MLSS near the lower end of that band until flux is proven.
An SBR follows a fill-and-draw sequence in a single tank. The five stages are Fill, React (aeration), Settle (gravity separation), Decant, and Idle. Because separation depends on gravity, MLSS is typically capped at 3,000 to 5,000 mg/L so sludge can settle within a 4-to-8-hour cycle. That gravity dependence makes SBR systems more sensitive to sludge bulking, when filamentous bacteria impair settling and raise effluent turbidity. For a concise process primer on the difference between mbr and sbr, pair that page with the parameter table below.
| Parameter | MBR (Membrane Bioreactor) | SBR (Sequencing Batch Reactor) |
|---|---|---|
| Separation Method | Physical Membrane Filtration (0.1–0.4 µm) | Gravity Sedimentation (Batch) |
| MLSS Concentration | 8,000 – 12,000 mg/L | 3,000 – 5,000 mg/L |
| Hydraulic Retention Time (HRT) | 4 – 8 Hours | 6 – 12 Hours |
| Sludge Retention Time (SRT) | 15 – 30 Days | 10 – 20 Days |
| Biomass Type | Suspended Growth | Suspended Growth |
Performance Comparison: Effluent Quality, Removal Efficiencies, and Reliability
Effluent quality benchmarks for industrial duty show MBR systems consistently achieving TSS concentrations below 1 mg/L and 6-log pathogen reduction, significantly outperforming SBR’s typical 10–30 mg/L TSS output. The membrane barrier keeps solids out of the effluent even during biological upsets. That reliability makes the MBR Membrane Bioreactor Wastewater Treatment System a common choice when projects must meet California Title 22-style reuse goals or discharge to sensitive waters.
According to California Title 22 section 60301.230, disinfected tertiary recycled water must keep a 7-day median total coliform at or below 2.2 MPN per 100 mL after filtration and disinfection. The same section allows no more than one sample above 23 MPN per 100 mL in any 30-day period, and no sample may exceed 240 MPN per 100 mL, wording re-verified against the current CCR text in 2026. SBR reliability still hinges on sludge settling. An unbalanced Food-to-Microorganism (F/M) ratio can collapse the settle phase and raise turbidity.
A further MBR advantage is retention of many emerging contaminants. High SRT plus physical retention often yields 70–90% removal of common pharmaceuticals such as ibuprofen and carbamazepine, whereas SBR removal rates typically range from 30–60% (per 2024 study in Water Research). MBR systems are more sensitive to high Fats, Oils, and Grease (FOG), which can foul membranes irreversibly. SBR systems usually tolerate grit better but remain vulnerable to hydraulic shock loads that disrupt batch timing.
| Pollutant | MBR Removal Efficiency | SBR Removal Efficiency |
|---|---|---|
| TSS (Total Suspended Solids) | >99% (<1 mg/L effluent) | 90% (10–30 mg/L effluent) |
| BOD (Biochemical Oxygen Demand) | >98% (<5 mg/L effluent) | 85–90% (15–30 mg/L effluent) |
| COD (Chemical Oxygen Demand) | 95% | 85% |
| Pathogens (Bacteria/Viruses) | 6-log removal | 2-log removal |
| Pharmaceuticals | 70–90% removal | 30–60% removal |
MBR vs SBR for Industrial Wastewater Reuse: Which Wins?
MBR is usually the better fit for industrial wastewater reuse when permits demand TSS below about 10 mg/L or Title 22-style tertiary polishing with stable turbidity. Membrane permeate typically stays below 1 mg/L TSS, which shortens the filtration train before disinfection. SBR can feed reuse only when settleability is stable and media filters or other tertiary steps are budgeted for turbidity spikes.
Can SBR meet industrial reuse turbidity goals?
SBR effluent at 10–30 mg/L TSS rarely satisfies unrestricted reuse without added filtration. Most plants we review for cooling-tower or process makeup still add sand or cloth filters after SBR, which erodes the CAPEX gap versus MBR. If FOG or grit control upstream is weak, protect membranes first or keep SBR plus polishing.
Footprint, Energy Use, and Operational Complexity: What’s the Trade-Off?
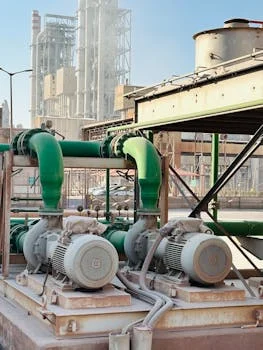
MBR systems achieve a biomass concentration (MLSS) of 8,000 to 12,000 mg/L, allowing for a 60% reduction in aeration tank volume compared to SBR systems which operate at 3,000 to 5,000 mg/L. In practical terms, a 1,000 m³/day MBR plant typically occupies approximately 200 m², whereas an SBR plant of the same capacity requires 500 m² to accommodate the lower biomass density and the necessary settling volume. For a 500 m³/day plant, this means MBR requires only 100 m² vs SBR’s 250 m². If industrial land costs are valued at $200/m², the MBR option saves $30,000 in land acquisition costs alone.
The trade-off for this space efficiency is energy consumption. MBR energy use ranges from 0.6 to 1.2 kWh/m³, primarily driven by the air blowers required for membrane scouring and the permeate pumps. Earlier plant benchmarks used that 0.6–1.2 kWh/m³ band. A 2025 Engineering review summarizes MBR energy at 0.4–1.15 kWh/m³ and operating costs at 0.09–0.45 USD/m³, versus 0.3–0.64 kWh/m³ for conventional activated sludge (Gao et al., 2025).
SBR systems remain lower at 0.3 to 0.5 kWh/m³ because they lack continuous membrane scouring. Operationally, MBR needs Clean-In-Place (CIP) and chemical backwash with sodium hypochlorite. SBR work focuses on cycle timing and sludge wasting, with precise automation for batch phases. On sites with tariffs above about $0.12/kWh, most plants we size still model both energy and membrane replacement before freezing the process.
| Factor | MBR (1,000 m³/day) | SBR (1,000 m³/day) |
|---|---|---|
| Required Footprint | 200 m² | 500 m² |
| Energy Consumption | 0.6 – 1.2 kWh/m³ | 0.3 – 0.5 kWh/m³ |
| Maintenance Complexity | High (Membrane CIP, fouling mgmt) | Medium (Cycle automation, decanter) |
| Sludge Yield | Lower (due to high SRT) | Higher |
MBR vs SBR Wastewater Treatment Cost Comparison
Projected 2025 CAPEX for MBR systems ranges from $1,200 to $1,800 per m³/day of capacity, roughly 40-50% higher than the $800 to $1,200 per m³/day typical for SBR installations. The higher initial cost of MBR is attributed to the membrane modules, high-pressure pumps, and sophisticated control systems. When evaluating the 10-year Total Cost of Ownership (TCO), the gap can narrow if discharge fees are high. That MBR vs SBR wastewater treatment cost comparison should always include land value, surcharge risk, and membrane replacement—not only blower kWh.
For example, in a 500 m³/day plant, MBR’s 10-year TCO might be $1.8M compared to SBR’s $1.2M. If the MBR effluent quality allows for water reuse or avoids $50,000/year in environmental non-compliance surcharges, the ROI period for the MBR investment is significantly shortened.
OPEX for MBR is higher, ranging from $0.20 to $0.40/m³, while SBR stays between $0.10 and $0.25/m³. A significant portion of MBR OPEX is membrane replacement. Modern PVDF membranes last between 5 and 10 years, with replacement costs currently benchmarked at $50–$100/m² of membrane area. For a 500 m³/day plant, an engineer should budget approximately $20,000 to $40,000 for membrane replacements every 7 years.
For comprehensive sludge management strategies to complement these systems, engineers should evaluate sludge management options for MBR and SBR systems to further optimize OPEX.
| Cost Category | MBR Benchmark (2025) | SBR Benchmark (2025) |
|---|---|---|
| CAPEX (per m³/day) | $1,200 – $1,800 | $800 – $1,200 |
| OPEX (per m³ treated) | $0.20 – $0.40 | $0.10 – $0.25 |
| Membrane Replacement | $50 – $100 per m² | N/A |
| 10-Year TCO (500 m³/day) | ~$1.8 Million | ~$1.2 Million |
Decision Tree: Which System Fits Your Project?
The decision to implement MBR over SBR is primarily dictated by discharge permit stringency and land availability, with MBR becoming the default choice when effluent reuse or footprint minimization is required. Use the following framework to guide your technology selection:
- Step 1: Effluent Requirements. Are your discharge limits <10 mg/L TSS or <20 mg/L BOD? If YES, choose MBR. If NO, proceed to Step 2.
- Step 2: Space Constraints. Is your available footprint for the treatment plant less than 300 m² per 500 m³/day capacity? If YES, choose MBR. If NO, proceed to Step 3.
- Step 3: Energy Budget. Is your target energy cost less than $0.15/kWh or is energy availability limited? If YES, SBR is more economical. If NO, proceed to Step 4.
- Step 4: Operational Staffing. Do you have onsite technical staff capable of managing membrane cleaning and chemical dosing? If NO, SBR’s simpler operation is preferable. If YES, MBR is viable.
- Step 5: Future Expansion. Do you anticipate needing to double capacity in the same footprint? MBR’s modular design allows for easier scaling by adding more membrane modules to existing tanks.
- Step 6: Pretreatment Risk. Is FOG or grit poorly controlled upstream? Budget coarse screens, oil traps, and grit removal before membranes, or favor SBR if pretreatment capital is constrained.
- Step 7: Reuse Pathway. Will effluent feed cooling, irrigation, or process reuse under tertiary rules? Membrane turbidity control usually shortens the polishing train versus SBR plus media filters.
"The decision tree typically leads to MBR for industrial reuse and SBR for municipal discharge where land is plentiful." — HydropureWater Engineering Group.
Case Study: Dairy Plant Upgrade at 500 m³/day
A 500 m³/day dairy plant in Jiangsu needed a <10 mg/L BOD limit inside a 200 m² footprint. MBR CAPEX was about 30% higher, yet it was the only option that met both constraints. The SBR option needed 350 m². It also needed sand filters for TSS, which pushed total cost near the MBR bid while using more land.
The plant selected MBR. By utilizing MBR system case studies in the Middle East as a reference for high-salinity dairy waste performance, they implemented a submerged flat-sheet system. After 12 months, average effluent TSS was 2 mg/L and BOD was 15 mg/L. The saved 150 m² hosted a new yogurt packaging line, adding a secondary ROI.
For more industry-specific data, see our food processing wastewater treatment engineering guide.
| Metric | MBR Choice (Actual) | SBR Alternative (Projected) |
|---|---|---|
| Total CAPEX | $900,000 | $600,000 (Base) / $850k (w/ filters) |
| Footprint Used | 150 m² | 350 m² |
| Effluent TSS | 2 mg/L | 20 mg/L |
| Compliance Status | Pass | Fail (without tertiary treatment) |
How does MBR compare to MBBR?
MBR uses membranes for solids separation at MLSS of 8,000–12,000 mg/L, while MBBR grows biofilm on plastic carriers and still needs secondary clarification. MBBR typically runs lower energy than MBR when scouring air is avoided, but effluent TSS after settling is closer to conventional activated sludge than to membrane permeate. Choose MBBR when land allows a clarifier and discharge limits sit near 15–30 mg/L TSS. Choose MBR when reuse turbidity or pathogen log-removal is the binding constraint.
How does DAF compare with MBR?
Dissolved air flotation (DAF) is a physicochemical solids and FOG separator, not a complete biological process like MBR. DAF often precedes biology on food, oil, and slaughterhouse wastewater to cut FOG before membranes or aeration tanks. Pairing DAF ahead of MBR protects membrane flux when influent FOG is high. Using DAF alone does not replace the COD and ammonia removal an MBR or SBR bioreactor provides.
How does A2O compare with MBR and SBR?
A2O (anaerobic-anoxic-oxic) is a continuous nutrient-removal configuration rather than a batch or membrane separation process. It adds anaerobic and anoxic zones ahead of the aerobic stage so phosphorus-accumulating organisms and denitrifiers work in sequence; MBR and SBR reach similar nitrogen goals only with selector zones or timed cycle phases. Korean project teams often search for mbr vs sbr vs a2o water_treatment 비교, with 비교 meaning comparison, because electronics and textile plants there face both total-nitrogen limits and reuse targets. Pick A2O when nitrogen permits drive design; add membranes to it (A2O-MBR) when reuse-grade TSS applies as well.
Who This Is For
Plant engineers and EPC contractors comparing footprint-limited industrial upgrades, reuse permits, or municipal plants with strict energy caps should use this framework. Teams that only need secondary discharge on large rural sites with low power cost may stop at SBR without membranes.
Who should look elsewhere: sites with uncontrolled FOG/grit and no pretreatment budget should not jump to membranes; fix screens and oil traps first. Next step: lock permit limits, available m², and kWh tariff, then request a duty-specific mass balance and membrane area estimate for your flow.
Frequently Asked Questions
What are the main disadvantages of MBR compared to SBR?
The primary disadvantages are higher energy consumption (0.6–1.2 kWh/m³) due to membrane scouring and the necessity for membrane replacement every 5–10 years. MBR also requires more intensive chemical cleaning (CIP) and is more sensitive to Fats, Oils, and Grease (FOG), which can lead to irreversible fouling if pretreatment is inadequate. Budget for screens, FOG traps, and CIP chemicals before awarding an MBR package.
Can MBR systems remove pharmaceuticals from wastewater?
Yes, MBRs are significantly more effective at removing pharmaceuticals (70–90% removal) than SBRs (30–60%). This is due to the high Sludge Retention Time (SRT) of 15–30 days, which allows specialized slow-growing bacteria to develop, and the physical membrane barrier that retains high-molecular-weight organic compounds. Removal still varies by compound hydrophobicity and plant temperature.
How often do MBR membranes need to be replaced, and what is the cost?
In industrial applications, PVDF membranes typically last 5 to 10 years depending on influent quality and maintenance. Replacement costs in 2025 are about $50 to $100 per square meter of membrane, or roughly $20,000–$40,000 every 7 years for a 500 m³/day plant. Track transmembrane pressure trends to schedule replacement before flux collapses.
Is SBR or MBR better for handling shock loads?
SBR is generally better at handling inorganic shock loads and grit because it lacks sensitive membrane surfaces. However, MBR is superior at handling biological shock loads (spikes in BOD/COD) because its high biomass concentration (MLSS 10,000+ mg/L) provides a much larger buffer of bacteria to process the incoming waste. Either process still needs equalization when peak-to-average flow exceeds design assumptions.
Does MBR always beat SBR on total cost of ownership?
No. MBR 10-year TCO for a 500 m³/day plant is often about $1.8M versus about $1.2M for SBR when land is cheap and discharge limits are moderate. MBR closes the gap when land exceeds about $200/m², reuse credits apply, or non-compliance surcharges near $50,000/year. Run both CAPEX and OPEX against your tariff before selecting.