MBR vs SBR Wastewater Treatment: 2025 Engineering Comparison with Data, Costs & Decision Tree
MBR (Membrane Bioreactor) and SBR (Sequencing Batch Reactor) are two leading wastewater treatment technologies, differing fundamentally in separation mechanisms: MBR uses submerged membranes (0.1–0.4 µm pore size) for physical filtration, while SBR relies on gravity settling in batch cycles. In 2025 benchmarks, MBR achieves 99% TSS removal and 95% COD reduction (per EPA NPDES data), compared to SBR’s 90% TSS and 85% COD. MBR’s compact footprint (60% smaller than SBR for equivalent capacity) and near-reuse-quality effluent make it ideal for space-constrained or high-standard applications, while SBR’s lower energy use (0.3–0.5 kWh/m³ vs MBR’s 0.6–1.2 kWh/m³) and simpler operation suit budget-sensitive projects. This guide provides a data-driven comparison to help you select the right system.
Why the MBR vs SBR Decision Matters: A Real-World Scenario
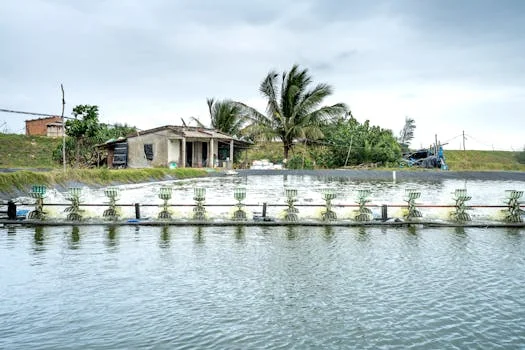
Selecting between MBR and SBR technologies directly impacts long-term operational costs, with MBR systems typically requiring 60% less footprint but 50-100% more energy than SBR counterparts. Consider a 500 m³/day dairy plant in Jiangsu that recently faced a 30% increase in BOD discharge limits. The plant’s existing footprint was hemmed in by production lines, leaving no room for the large settling tanks required by a traditional SBR expansion. The management had to weigh the immediate capital expenditure (CAPEX) of an MBR system against the risk of non-compliance fines and the high cost of land acquisition for an expanded SBR.
The stakes in this decision are multifaceted. Compliance is the primary driver; as environmental regulations tighten globally, the "settleability" of sludge in an SBR becomes a liability if the effluent must meet reuse standards. Conversely, for a municipal project with ample land and a strict energy budget, the operational expenditure (OPEX) of membrane scouring in an MBR could be prohibitive. Key decision factors include effluent quality requirements, available footprint, energy availability, CAPEX/OPEX constraints, and the technical expertise of the onsite operators. This article compares MBR and SBR across these critical parameters, providing a data-backed decision tree to match your specific project needs.
How MBR and SBR Work: Process Mechanisms and Key Parameters
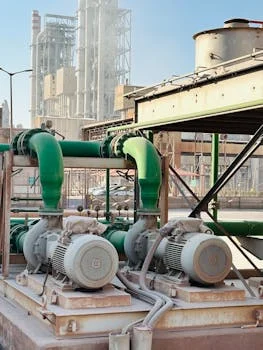
The fundamental mechanical difference between these technologies lies in solids-liquid separation: MBR utilizes a physical membrane barrier with 0.1–0.4 µm pores, whereas SBR depends on gravity-driven sedimentation in a temporal batch sequence. MBR is often described as a "physical filter" for wastewater. It combines biological degradation with membrane filtration, usually employing Zhongsheng’s DF series MBR membrane modules for submerged applications. These membranes, typically made of PVDF or PE, operate at high Mixed Liquor Suspended Solids (MLSS) concentrations of 8,000 to 12,000 mg/L. To prevent fouling, constant aeration is required to "scour" the membrane surface, which contributes to the technology's higher energy profile.
In contrast, an SBR operates on a "fill-and-draw" principle within a single tank. The process moves through five distinct stages: Fill, React (aeration), Settle (gravity separation), Decant (removal of treated effluent), and Idle. Because separation depends on gravity, the MLSS is typically capped at 3,000 to 5,000 mg/L to ensure the sludge can settle effectively within the 4-to-8-hour cycle time. While simpler, this reliance on gravity makes SBR systems more sensitive to "sludge bulking," where filamentous bacteria prevent the sludge from settling, leading to poor effluent quality.
| Parameter | MBR (Membrane Bioreactor) | SBR (Sequencing Batch Reactor) |
|---|---|---|
| Separation Method | Physical Membrane Filtration (0.1–0.4 µm) | Gravity Sedimentation (Batch) |
| MLSS Concentration | 8,000 – 12,000 mg/L | 3,000 – 5,000 mg/L |
| Hydraulic Retention Time (HRT) | 4 – 8 Hours | 6 – 12 Hours |
| Sludge Retention Time (SRT) | 15 – 30 Days | 10 – 20 Days |
| Biomass Type | Suspended Growth | Suspended Growth |
Performance Comparison: Effluent Quality, Removal Efficiencies, and Reliability
Effluent quality benchmarks for 2025 show MBR systems consistently achieving TSS concentrations below 1 mg/L and 6-log pathogen reduction, significantly outperforming SBR’s typical 10–30 mg/L TSS output. The physical barrier of the membrane ensures that even during biological upsets, solids cannot escape into the effluent. This makes Zhongsheng’s MBR systems for high-effluent-quality applications the preferred choice for projects requiring Title 22 reuse standards or discharge into sensitive water bodies. SBR reliability, however, is contingent on the settling characteristics of the sludge; if the Food-to-Microorganism (F/M) ratio is unbalanced, the gravity settling phase fails, resulting in high turbidity.
A critical advantage of MBR is its ability to remove emerging contaminants. Due to the high SRT and the physical retention of the membrane, MBR achieves 70–90% removal of common pharmaceuticals, such as ibuprofen and carbamazepine, whereas SBR removal rates typically range from 30–60% (per 2024 study in Water Research). However, MBR systems are more sensitive to high concentrations of Fats, Oils, and Grease (FOG), which can cause irreversible membrane fouling. SBR systems are generally more resilient to grit and inorganic debris but can be vulnerable to hydraulic shock loads that disrupt the batch timing.
| Pollutant | MBR Removal Efficiency | SBR Removal Efficiency |
|---|---|---|
| TSS (Total Suspended Solids) | >99% (<1 mg/L effluent) | 90% (10–30 mg/L effluent) |
| BOD (Biochemical Oxygen Demand) | >98% (<5 mg/L effluent) | 85–90% (15–30 mg/L effluent) |
| COD (Chemical Oxygen Demand) | 95% | 85% |
| Pathogens (Bacteria/Viruses) | 6-log removal | 2-log removal |
| Pharmaceuticals | 70–90% removal | 30–60% removal |
Footprint, Energy Use, and Operational Complexity: What’s the Trade-Off?
MBR systems achieve a biomass concentration (MLSS) of 8,000 to 12,000 mg/L, allowing for a 60% reduction in aeration tank volume compared to SBR systems which operate at 3,000 to 5,000 mg/L. In practical terms, a 1,000 m³/day MBR plant typically occupies approximately 200 m², whereas an SBR plant of the same capacity requires 500 m² to accommodate the lower biomass density and the necessary settling volume. For a 500 m³/day plant, this means MBR requires only 100 m² vs SBR’s 250 m². If industrial land costs are valued at $200/m², the MBR option saves $30,000 in land acquisition costs alone.
The trade-off for this space efficiency is energy consumption. MBR energy use ranges from 0.6 to 1.2 kWh/m³, primarily driven by the air blowers required for membrane scouring and the permeate pumps. SBR systems are significantly more efficient, consuming only 0.3 to 0.5 kWh/m³ because they lack the membrane resistance and the need for continuous scouring. Operationally, MBR requires specialized maintenance, including Clean-In-Place (CIP) procedures and regular backwashing with chemicals like sodium hypochlorite. SBR operation is simpler, focusing on cycle timing and sludge wasting, though it requires precise automation to manage the batch phases effectively.
| Factor | MBR (1,000 m³/day) | SBR (1,000 m³/day) |
|---|---|---|
| Required Footprint | 200 m² | 500 m² |
| Energy Consumption | 0.6 – 1.2 kWh/m³ | 0.3 – 0.5 kWh/m³ |
| Maintenance Complexity | High (Membrane CIP, fouling mgmt) | Medium (Cycle automation, decanter) |
| Sludge Yield | Lower (due to high SRT) | Higher |
Cost Comparison: CAPEX, OPEX, and 10-Year TCO Benchmarks for 2025
Projected 2025 CAPEX for MBR systems ranges from $1,200 to $1,800 per m³/day of capacity, roughly 40-50% higher than the $800 to $1,200 per m³/day typical for SBR installations. The higher initial cost of MBR is attributed to the membrane modules, high-pressure pumps, and sophisticated control systems. However, when evaluating the 10-year Total Cost of Ownership (TCO), the gap can narrow if discharge fees are high. For example, in a 500 m³/day plant, MBR’s 10-year TCO might be $1.8M compared to SBR’s $1.2M. If the MBR effluent quality allows for water reuse or avoids $50,000/year in environmental non-compliance surcharges, the ROI period for the MBR investment is significantly shortened.
OPEX for MBR is higher, ranging from $0.20 to $0.40/m³, while SBR stays between $0.10 and $0.25/m³. A significant portion of MBR OPEX is membrane replacement. Modern PVDF membranes last between 5 and 10 years, with replacement costs currently benchmarked at $50–$100/m² of membrane area. For a 500 m³/day plant, an engineer should budget approximately $20,000 to $40,000 for membrane replacements every 7 years. For comprehensive sludge management strategies to complement these systems, engineers should evaluate sludge management options for MBR and SBR systems to further optimize OPEX.
| Cost Category | MBR Benchmark (2025) | SBR Benchmark (2025) |
|---|---|---|
| CAPEX (per m³/day) | $1,200 – $1,800 | $800 – $1,200 |
| OPEX (per m³ treated) | $0.20 – $0.40 | $0.10 – $0.25 |
| Membrane Replacement | $50 – $100 per m² | N/A |
| 10-Year TCO (500 m³/day) | ~$1.8 Million | ~$1.2 Million |
MBR vs SBR Decision Tree: Which System Fits Your Project?
The decision to implement MBR over SBR is primarily dictated by discharge permit stringency and land availability, with MBR becoming the default choice when effluent reuse or footprint minimization is required. Use the following framework to guide your technology selection:
- Step 1: Effluent Requirements. Are your discharge limits <10 mg/L TSS or <20 mg/L BOD? If YES, choose MBR. If NO, proceed to Step 2.
- Step 2: Space Constraints. Is your available footprint for the treatment plant less than 300 m² per 500 m³/day capacity? If YES, choose MBR. If NO, proceed to Step 3.
- Step 3: Energy Budget. Is your target energy cost less than $0.15/kWh or is energy availability limited? If YES, SBR is more economical. If NO, proceed to Step 4.
- Step 4: Operational Staffing. Do you have onsite technical staff capable of managing membrane cleaning and chemical dosing? If NO, SBR’s simpler operation is preferable. If YES, MBR is viable.
- Step 5: Future Expansion. Do you anticipate needing to double capacity in the same footprint? MBR’s modular design allows for easier scaling by adding more membrane modules to existing tanks.
"The decision tree typically leads to MBR for industrial reuse and SBR for municipal discharge where land is plentiful." — Zhongsheng Engineering Group.
Case Study: MBR vs SBR in a 500 m³/day Food Processing Plant
A comparative engineering analysis for a 500 m³/day dairy processing facility in Jiangsu demonstrated that while MBR had a 30% higher initial CAPEX, it was the only technology capable of meeting a <10 mg/L BOD discharge limit within a 200 m² footprint. The facility evaluated both technologies for an upgrade required by new provincial standards. The SBR proposal required 350 m² and an additional tertiary filtration step (sand filters) to reach the required TSS limits, which would have increased the total project cost to nearly that of the MBR system while still taking up more space.
The plant ultimately selected MBR. By utilizing MBR system case studies in the Middle East as a reference for high-salinity dairy waste performance, they implemented a submerged flat-sheet system. The results after 12 months showed an average effluent TSS of 2 mg/L and BOD of 15 mg/L, comfortably meeting compliance. the compact footprint allowed the plant to use the "saved" 150 m² to install a new yogurt packaging line, effectively generating a secondary ROI from the MBR choice. For more industry-specific data, see our food processing wastewater treatment engineering guide.
| Metric | MBR Choice (Actual) | SBR Alternative (Projected) |
|---|---|---|
| Total CAPEX | $900,000 | $600,000 (Base) / $850k (w/ filters) |
| Footprint Used | 150 m² | 350 m² |
| Effluent TSS | 2 mg/L | 20 mg/L |
| Compliance Status | Pass | Fail (without tertiary treatment) |
Frequently Asked Questions
What are the main disadvantages of MBR compared to SBR?
The primary disadvantages are higher energy consumption (0.6–1.2 kWh/m³) due to membrane scouring and the necessity for membrane replacement every 5–10 years. MBR also requires more intensive chemical cleaning (CIP) and is more sensitive to Fats, Oils, and Grease (FOG), which can lead to irreversible fouling if pretreatment is inadequate.
Can MBR systems remove pharmaceuticals from wastewater?
Yes, MBRs are significantly more effective at removing pharmaceuticals (70–90% removal) than SBRs (30–60%). This is due to the high Sludge Retention Time (SRT) of 15–30 days, which allows specialized slow-growing bacteria to develop, and the physical membrane barrier that retains high-molecular-weight organic compounds.
How often do MBR membranes need to be replaced, and what is the cost?
In industrial applications, PVDF membranes typically last 5 to 10 years depending on the influent characteristics and maintenance quality. Replacement costs in 2025 are approximately $50 to $100 per square meter of membrane. For a 500 m³/day plant, this equates to a $20,000–$40,000 reinvestment every 7 years on average.
Is SBR or MBR better for handling shock loads?
SBR is generally better at handling inorganic shock loads and grit because it lacks sensitive membrane surfaces. However, MBR is superior at handling biological shock loads (spikes in BOD/COD) because its high biomass concentration (MLSS 10,000+ mg/L) provides a much larger "buffer" of bacteria to process the incoming waste.