How to Choose MBR or Activated Sludge for Woodstock Plastics Wastewater
For plastics and rubber wastewater in Woodstock, Illinois, MBR is usually the stronger option when the stream is high-strength, variable, difficult to clarify, or needed for reuse. A 2024 rubber-effluent study reported more than 98% COD reduction, from 22,158 ± 2,859 mg/L to 118 mg/L, while cited work on latex wastewater found more than 96% COD removal. MBR retains more biomass and solids than conventional activated sludge, but it requires effective pretreatment, controlled membrane cleaning, and trained operators. CAS remains defensible for a uniform influent, available land, no reuse target, and a serviceable clarifier that reliably meets current discharge requirements.
Start with the actual wastewater, not the equipment. Characterize batch variation, polymer fines, latex, oils, surfactants, nitrogen, and the discharge or reuse destination. The supplied screening rule is practical: if COD exceeds 5,000 mg/L or NH3-N exceeds 200 mg/L, place MBR on the shortlist; below those thresholds, CAS may remain viable if the basin is structurally sound and winter nitrification is reliable.
MBR gains strength where land is limited, reuse has value, sludge settling is unreliable, or cold-weather ammonia compliance is uncertain. CAS gains strength where the influent is uniform, no reuse target exists, operators already know the process, and the clarifier remains serviceable. Woodstock’s cold winters strengthen the MBR case, but they do not decide it by themselves: mixed-liquor temperature, sludge retention time, permit limits, and measured plant performance must still be considered. The 2026 MBR cost-per-m³ guide provides a useful framework for evaluating the retrofit.
Why Plastics and Rubber Wastewater Changes the Comparison
Plastics and rubber plants generate process streams that can differ substantially from municipal sewage. Typical constituents include polymer emulsions, latex, pellets, short fibers, surfactants, oils, plasticizers, and periodic washdown or startup discharges. The composition and volume can change with each production campaign, so a design based only on an annual average can understate peak biological loading, solids carryover, and pretreatment demand.
HydropureWater’s industrial comparison, published in 2024, reports that injection molding, extrusion, and polyurethane operations can produce 5,000–25,000 mg/L COD, with a BOD/COD ratio of 0.3–0.5. It also reports 100–800 mg/L NH3-N, 200–1,500 mg/L sulfate, and TSS above 1,000 mg/L in latex, gasket, and hose operations. These are screening ranges for industrial streams, not Woodstock design values.
The same 2024 source cites a 2024 MDPI natural-rubber dataset at 22,158 ± 2,859 mg/L COD. That is a specific high-strength study case, not a universal influent assumption. Batch discharges can superimpose organic, ammonia, and solids shocks, making equalization and pretreatment part of the treatment decision rather than auxiliary equipment.
| Evidence type | Reported value or condition | How to use it in a Woodstock decision |
|---|---|---|
| 2024 industrial screening range | 5,000–25,000 mg/L COD; BOD/COD 0.3–0.5 | Tests whether MBR belongs on the shortlist |
| 2024 industrial screening range | 100–800 mg/L NH3-N; 200–1,500 mg/L sulfate | Sets the initial nitrogen and mixing assessment |
| 2024 MDPI natural-rubber study case | 22,158 ± 2,859 mg/L COD | Illustrates a high-strength case, not a site default |
| Site-specific input required | Flow, COD, BOD, nitrogen, TSS, pH, oils, surfactants, toxicity | Defines equalization, biology, pretreatment, and permit loading |
Use an industrial effluent testing guide to establish the permit basis, COD/BOD ratio, nutrient balance, inhibitory loading, and reuse criteria before comparing equipment.
MBR and Conventional Activated Sludge: Treatment Mechanisms Compared
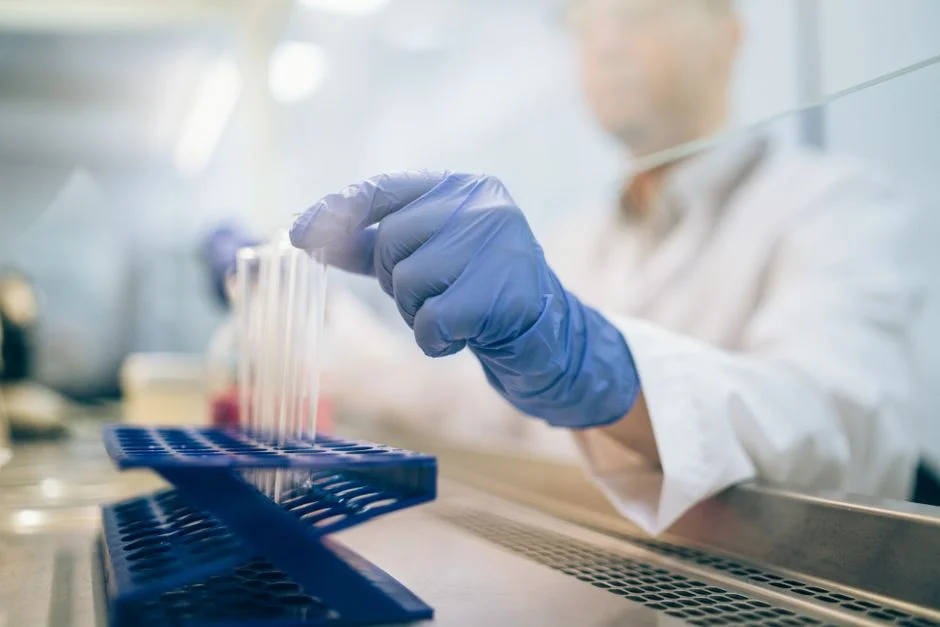
Conventional activated sludge couples aerobic biological oxidation with gravity clarification and return activated sludge. A membrane bioreactor retains the activated-sludge biology but replaces the clarifier’s settling function with submerged ultrafiltration, creating a physical barrier between mixed liquor and permeate. This separation allows the process to retain more biomass and suspended solids without relying on final settling.
The comparison in HydropureWater’s 2019 plant-wide modeling review gives CAS MLSS of 2,500–4,000 mg/L and MBR MLSS of 8,000–12,000 mg/L, with MBR SRT commonly 20–40 days. The higher inventory improves process stability and supports slower-growing organisms, but it also raises the consequences of poor pretreatment. Membrane solids retention is a barrier, not permission to send large debris, oil, or excessive polymer load into the reactor.
A 2024 MDPI rubber-effluent study reported more than 98% COD reduction for an AnMBR followed by an A/O MBR train, from 22,158 ± 2,859 mg/L to 118 mg/L. The same review cites a UF flat-sheet MBR that removed more than 96% COD and more than 60% total nitrogen from skim latex wastewater. These are study results with defined feeds and reactor arrangements, not guaranteed performance for an unspecified Woodstock stream.
The 2019 model reported direct emissions of 0.85 kgCO2eq/m³ for CAS and 0.91 kgCO2eq/m³ for MBR. That narrow difference is unlikely to determine the project by itself; reuse value, sludge hauling, membrane replacement, chemicals, energy, downtime, and compliance exposure usually carry more weight. The broader MBR advantages and disadvantages review explains why technology selection must follow characterization and pretreatment.
| Decision factor | Conventional activated sludge | MBR |
|---|---|---|
| Biological separation | Gravity clarification and return activated sludge | Submerged ultrafiltration retains biomass and solids |
| Solids retention | MLSS 2,500–4,000 mg/L in the cited 2019 comparison | MLSS 8,000–12,000 mg/L in the cited comparison |
| Sludge retention time | Depends on clarifier performance and wasting | Commonly 20–40 days in the cited comparison |
| Effluent consistency | Dependent on floc settleability and clarifier operation | Less dependent on final sludge settling |
| Reuse readiness | May require additional solids removal | Better suited to low-solids reuse streams |
| Operator requirements | Familiar activated-sludge and RAS controls | TMP, flux, scour, and cleaning control |
| Pretreatment | Solids control remains important | More sensitive to debris, oil, and polymer fouling |
| Energy and chemicals | Lower aeration and no membrane-cleaning chemicals | Added air scour, permeate pumping, and cleaning chemicals |
| Capital intensity | Lower installed baseline where land and tankage are available | Higher equipment scope, partly offset by footprint reduction |
An integrated MBR wastewater treatment system should therefore be evaluated as a complete biological, pretreatment, control, and maintenance system rather than as a replacement clarifier alone.
Pretreatment That Keeps Either Treatment Train Reliable
A defensible treatment train begins with flow equalization, pH correction, screening, removal of free oil and floating polymer, solids reduction, biological treatment, and disinfection or reuse polishing where required. The order matters because shock loads can overwhelm biology and solids can damage membranes before either process has an opportunity to stabilize the stream.
HydropureWater’s 2019 comparison recommends a 2–3 mm aperture GX Series rotary mechanical bar screen for plastic pellets, fibers, and stringy latex agglomerates. A GX Series rotary mechanical bar screen protects downstream equipment from material that could blind a membrane cassette or overload a clarifier weir. Screening alone does not remove dissolved or emulsified contaminants.
Where emulsified oils, free latex, surfactants, or floating polymer fragments are present, the design needs DAF pretreatment for oil and latex removal or another validated oil-water separation step. Dense grit, inorganic filler, and settleable solids require a lamella or high-efficiency sedimentation tank where biological loading and membrane fouling would otherwise be aggravated.
| Front-end condition | Required evaluation | Reason |
|---|---|---|
| Polymer fines, pellets, fibers | Capture efficiency and peak loading | Protect clarifiers and membranes |
| Oil, grease, surfactants | Emulsification, free-oil fraction, DAF performance | Limit membrane fouling and toxicity |
| Fillers, grit, latex agglomerates | Removal efficiency and solids concentration | Reduce biological solids loading |
| Batch washdown | Equalization volume and release rate | Prevent hydraulic and loading shocks |
| Peak-hour flow | Headworks and biological hydraulic capacity | Avoid untreated bypass or washout |
Membrane retention changes the consequences of pretreatment, not the need for it. Insufficient front-end solids and oil removal increases cleaning demand, chemical consumption, and membrane replacement risk. Before finalizing either treatment train, request performance data for polymer fines, oil and grease, surfactant load, TSS, and peak-hour flow rather than accepting only nominal equipment ratings.
Cold-Weather Nitrification and Year-Round Compliance
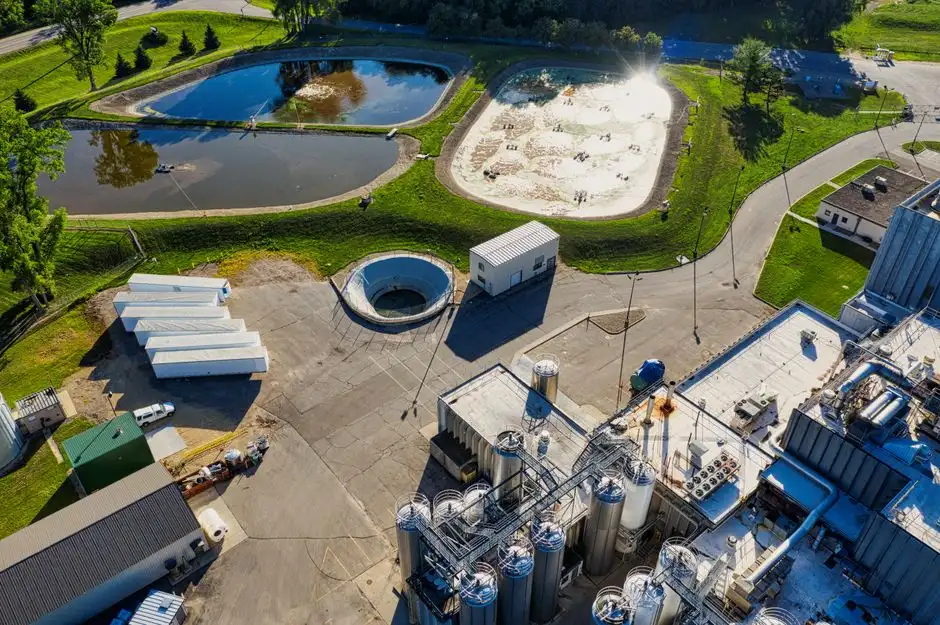
Nitrifier growth slows as temperature falls, so cold-weather compliance must be evaluated using mixed-liquor temperature, biological inventory, SRT, dissolved oxygen, alkalinity, and toxicity together. A technology with more retained biomass is not automatically compliant if aeration, alkalinity, or inhibitory compounds are inadequate.
HydropureWater’s 2024 industrial comparison states that at 10 °C, CAS typically loses more than half of its design nitrification rate. It reports that a 20–60 day SRT MBR can retain sufficient nitrifier inventory to maintain more than 80% of design nitrification at that temperature. These findings support considering MBR where ammonia compliance is seasonally exposed, but they do not establish the performance of a specific reactor.
The same source gives submerged PVDF flat-sheet MBR design expectations of below 1 mg/L NH3-N at warm mixed-liquor temperatures and 3–8 mg/L below 12 °C. These are design expectations, not guarantees for an unspecified plastics or rubber stream. Where the proposed ammonia limit is close to expected performance, seasonal pilot or bench testing may be necessary.
Existing operating history is more useful than a generic regional assumption. Review at least one full winter of mixed-liquor temperature, influent ammonia, effluent ammonia, SRT, DO, and alkalinity records before concluding that CAS will fail or succeed. This record should identify whether limitations arose from biology, clarification, loading, alkalinity, or permit conditions.
Finally, separate equipment capability from legal authorization. Confirm the current discharge route, applicable pretreatment or industrial-user requirements, monitoring provisions, and sewer acceptance criteria with the issuing Woodstock-area authority. Permit conditions from Minnesota, Georgia, or another jurisdiction are not evidence of local requirements. The discharge-limit review method illustrates why each receiving authority must be checked independently.
Membrane Operations, Maintenance, and Failure Modes
MBR performance depends on transmembrane pressure, normalized flux, membrane permeability, air scour, permeate control, and disciplined cleaning decisions. The equipment supplier should define these variables in the operating manual and acceptance criteria; a permeate-turbidity result alone does not demonstrate fouling control.
In the 2024 MDPI rubber-effluent study, Phase 1 operation was stable at 42 ± 4 kPa TMP and 25 ± 4 LMH flux, with a CEB trigger around 50–60 kPa. The cited operating program uses CEB every 1–7 days and recovery CIP every 6–12 months. Actual frequency depends on the feed, pretreatment, temperature, flux, and cleaning program.
The 2019 comparison cites backwashing, scheduled chemical cleaning on a 1–4 week cycle, and aeration optimization. It identifies NaOCl at 500–1,000 mg/L for organic fouling and citric acid at 1,000–2,000 mg/L for inorganic scaling. These values are cleaning-program references, not instructions to dose without membrane compatibility and site chemistry review.
| Operational signal | What the plant should do | Risk if ignored |
|---|---|---|
| Rising TMP or falling normalized flux | Trend both values and compare with baseline | More frequent recovery cleaning and production loss |
| Changing scour performance | Verify air delivery and diffuser condition | Fouling accumulation |
| Cleaning-cycle deterioration | Review pretreatment for solids, oil, and polymer | Irreversible fouling |
| Chemical-cleaning results | Inspect chemistry, dose, temperature, and contact conditions | Ineffective cleaning or membrane damage |
| Recovery clean | Log conditions and return-to-service performance | Loss of operating history and early replacement |
Use this sequence: trend TMP and normalized flux; verify scour airflow; review pretreatment performance; perform scheduled chemically enhanced backwashing; inspect cleaning chemistry; and log every recovery clean. A rising TMP trend is not merely a maintenance nuisance. It can lead to shorter membrane life, loss of production, and premature replacement. The DF MBR membrane module should therefore be evaluated together with its controls and operating envelope, while the ultrafiltration comparison helps distinguish UF reuse requirements from desalination needs.
Footprint, Reuse Value, and the 2026 Investment Decision
The HydropureWater verified product catalog states that its integrated MBR system occupies approximately 60% less space than conventional systems and is rated for 10–2,000 m³/day. These are product specifications, not independent field measurements or a guarantee that every retrofit will achieve the same footprint reduction.
Reuse can materially change the investment case. Process rinse, equipment washing, or cooling-tower makeup may justify MBR when a conventional clarifier would need rebuilding or additional solids removal. Each reuse application requires a separate water-quality, compatibility, and operational review; “reuse-ready” is not a universal discharge standard.
The 2024 lifecycle analysis summarized by HydropureWater found ArMBR cost approximately 17% above CAS and 23% above AnMBR plus CAS. The same source reports skid or containerized MBR installation at 4–8 weeks, compared with a multi-month CAS tankage outage. The latter is a reported case comparison, not a contractual delivery promise for a Woodstock site.
| Decision trigger | CAS answer | MBR answer | Required evidence |
|---|---|---|---|
| COD above 5,000 mg/L | Retain only if biological loading and settling are demonstrated | Place MBR on shortlist | Batch COD, BOD, flow, and biodegradability data |
| NH3-N above 200 mg/L | Retain if winter SRT and nitrification are reliable | Place MBR on shortlist | Winter temperature, SRT, DO, alkalinity, and ammonia records |
| Reuse required | Usually requires additional solids treatment | Stronger candidate, subject to reuse criteria | Water-quality and compatibility specification |
| Constrained land | Retain only if existing tankage fits | Stronger candidate | Site plan and confirmed equipment footprint |
| Polymer carryover | Clarifier carryover and settling risk | Physical retention advantage, but fouling risk remains | Fines characterization and pretreatment trial data |
| Clarifier condition | Repair and performance-test if structurally sound | May eliminate the need for a new clarifier | Structural inspection and remaining useful-life assessment |
| Operator capability | Familiar process controls | Requires membrane-specific training | Training plan, SOPs, and competency demonstration |
Require the lifecycle model to include membrane replacement, cleaning chemicals, energy, sludge hauling, reuse value, avoided tankage, permit risk, downtime, and disposal or sewer surcharges. Do not accept a quote based only on installed equipment cost or flow capacity.
The procurement sequence is: characterize the wastewater; confirm the permit and reuse basis; test cold-weather performance where necessary; size pretreatment and biology; build the lifecycle model; then verify guarantee-performance conditions. Keep the process moving through MBR advantages and disadvantages and the 2026 MBR cost-per-m³ guide, but do not treat either as substitutes for site data.
Frequently Asked Questions
How much does MBR cost compared with conventional activated sludge for plastics wastewater?
The 2024 lifecycle analysis summarized by HydropureWater found ArMBR approximately 17% above CAS and 23% above AnMBR plus CAS. For a defensible Woodstock budget, request quotations using the same design flow, load basis, pretreatment scope, reuse value, energy rate, chemical cost, membrane-replacement interval, downtime allowance, and disposal cost for both alternatives. Published percentages do not provide a site price.
When does the wastewater screening rule justify an MBR shortlist?
Use COD above 5,000 mg/L or NH3-N above 200 mg/L as a screening trigger, not a complete design rule. The buyer should request batch flow and load data, biodegradability, mixed-liquor temperature, SRT, and seasonal ammonia performance before sizing either process.
Can an MBR retrofit be installed faster than new CAS tankage?
The 2024 source reports a 4–8 week installation window for skid or containerized MBR delivery, compared with a multi-month CAS tankage outage. A Woodstock supplier should confirm that window against structural condition, tie-ins, pretreatment modification, utility availability, controls integration, commissioning, and production shutdown requirements.
Does a low-TSS MBR effluent automatically satisfy the site’s discharge requirements?
No. Equipment performance and discharge authorization are separate. Ask the supplier for guaranteed effluent parameters and require confirmation of the current permit, sewer acceptance criteria, monitoring, local pretreatment obligations, and reuse limits from the issuing Woodstock-area authority.
What should I request when selecting an MBR supplier?
Request the guaranteed flow and load basis, membrane material and effective area, pretreatment criteria, controls, aeration and cleaning program, guarantees, replacement terms, operator training, and lifecycle assumptions. Also require evidence that the proposed membrane, chemical program, and cleaning intervals address the measured polymer, oil, TSS, temperature, and batch-loading conditions.