Why Plastics and Rubber Wastewater in Blooming Prairie Is a Special Case
Plastics and rubber plants around Blooming Prairie, MN, push wastewater characteristics that are nowhere close to municipal-strength sewage. Injection-molding, extrusion, and polyurethane lines discharge 5,000–25,000 mg/L COD with a BOD/COD ratio of 0.3–0.5, while latex compounding, gasket, and hose operations add 100–800 mg/L NH3-N, 200–1,500 mg/L sulfate, and recurring pulses of polymer fines and latex carryover that drive TSS well above 1,000 mg/L. A 2024 MDPI study on natural rubber effluent (published 2024-06, S2) calibrated this load at 22,158 ± 2,859 mg/L COD, plus high NH3 and SO4 — the same range a Blooming Prairie plant can see on a Monday morning startup after a weekend washdown.
Generic MBR-vs-CAS guides written for municipal WWTPs do not address this signature. Two local factors make the choice harder, and more decisive, here than in warmer climates or coastal industrial parks:
- Regulatory overlay. Discharges to surface water or to the Blooming Prairie POTW are policed by MPCA Industrial Stormwater (permit MNR050000) and 40 CFR 433 (metal finishing) or 40 CFR 463 (plastics molding and forming) categorical pretreatment standards. A CAS basin that is "usually in compliance" can miss monthly-average NH3-N and TSS limits when the influent swings.
- Cold winters. Mixed-liquor temperatures drop to 8–12 °C from December through March, which slows CAS nitrification to a near-halt. A high-SRT MBR holds a much larger nitrifier population, which is the structural reason the comparison tilts toward membranes here.
If your influent looks more like the MDPI rubber dataset than like residential sewage, the technology decision lives in a different envelope than the standard municipal MBR vs CAS write-up suggests.
Conventional Activated Sludge: How It Works in a Plastics and Rubber Plant
Most Blooming Prairie-area plastics and rubber plants already own a CAS train: equalization → screening → pH neutralization → aeration basin → secondary clarifier → chlorination or UV. The basin is typically run at MLSS 2,000–4,000 mg/L, SRT 5–15 d, and HRT 18–36 h — a configuration inherited from municipal templates, not designed for this stream.
On a plastics/rubber duty cycle, the failure modes are predictable and recurring:
- Filamentous bulking from surfactant and latex-rich feed; sludge volume index climbs past 250 mL/g and the clarifier blanket washes out.
- Foam events from release agents and polymer additives that entrain in the aeration basin and overflow weirs.
- Chronic winter nitrification failure below 12 °C, where nitrifier growth rates collapse and effluent NH3-N misses MPCA monthly averages.
- Clarifier polymer shock loading when a batch dump of purge water from a molding line hits the basin.
The MDPI 2024 rubber-effluent review (S2) lists the conventional systems still deployed across the global rubber industry: facultative ponds, anaerobic filter beds, rotating biological contactors, aerated lagoons, UASB, and oxidation ditches. Realistic CAS performance on this stream bands at 80–92% COD removal, 50–80% NH3-N, and 30–60% TN — which often fails MPCA monthly-average limits for ammonia and TSS during cold months. The asset has value, but it is not a stable compliance platform for a high-strength, high-NH3 plastics or rubber stream under southern Minnesota winter conditions.
Membrane Bioreactor: What Changes When You Add the Membrane Cassette
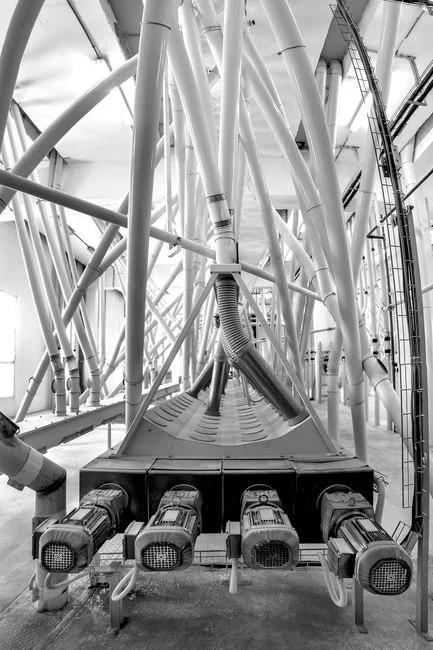
Adding a submerged MBR cassette train converts the same basin envelope into a much tighter system: equalization → fine screening (≤2 mm, commonly with a GX series rotary mechanical bar screen) → anoxic zone → aerobic basin (MLSS 8,000–12,000 mg/L, SRT 20–60 d) → submerged UF membrane cassette (0.03–0.1 µm pore size) → permeate pump → UV or ozone polish. The HydropureWater MBR membrane bioreactor system is rated for 10–2,000 m³/d with sub-1 µm filtration and roughly 60% smaller footprint than a CAS train of the same duty — useful when a Blooming Prairie plant is boxed in by the existing concrete basin footprint.
The performance band for this stream is now well documented. The same MDPI 2024 study (S2) reported >98% COD reduction (22,158 → 118 mg/L) on high-strength rubber effluent using an AnMBR + A/O MBR train, and earlier work cited in that review showed UF flat-sheet MBR alone removing >60% TN and >96% COD from skim latex wastewater. For a Blooming Prairie engineer, the practical takeaway is that a properly designed MBR with a DF series PVDF flat sheet MBR cassette can hold effluent COD below 30 mg/L, NH3-N below 1 mg/L at warm mixed-liquor temperatures, and TSS below 5 mg/L — water-reuse quality from a basin that already exists on the site.
Why the membrane makes the difference: the physical UF barrier decouples SRT from HRT, so the basin can hold 8,000–12,000 mg/L MLSS at 20–60 d SRT. That retains slow growers (nitrifiers, sulfur oxidizers, polymer-degrading specialists) that CAS washes out with the clarifier sludge, and it produces a near-reuse permeate that can feed cooling-tower make-up or process rinse.
Honest trade-offs: MBR needs continuous membrane aeration scour (bubble-flow rate roughly 0.3–0.6 m³/h per m² membrane area for flat-sheet PVDF), periodic chemically enhanced backwash (CEB) every 1–7 days, and a recovery clean (CIP) every 6–12 months. Budget 0.05–0.15 kWh/m³ extra energy versus CAS — the cost of running the membrane air scour pumps and permeate pumps. This is the operating delta a plant manager needs to price in before signing the PO. If you want the broader engineering context on the AAO variant behind the MBR, the AAO process advantages and disadvantages engineering guide covers the nutrient-removal mechanics in depth.
MBR vs CAS: Parameter-by-Parameter for Plastics and Rubber Duty
The table below is the working reference for the comparison. Numbers are drawn from the 2024 MDPI rubber-effluent study (S2), the 2019 plant-wide modelling comparison (S3), and standard MBR design references for high-strength industrial duty.
| Parameter | CAS (existing) | Submerged MBR (retrofit) |
|---|---|---|
| MLSS | 2,000–4,000 mg/L | 8,000–12,000 mg/L |
| SRT | 5–15 d | 20–60 d |
| HRT | 18–36 h | 12–24 h |
| Effluent COD | 60–120 mg/L (85–92% removal) | <30 mg/L (>96–98% removal) |
| Effluent NH3-N | 5–30 mg/L (warm); 20–60 mg/L (<12 °C) | <1 mg/L (warm); 3–8 mg/L (<12 °C) |
| Effluent TSS | 20–80 mg/L | <5 mg/L |
| Footprint (relative) | 1.0× baseline | ~0.4× baseline (60% smaller) |
| Observed sludge yield | 0.3–0.5 kg TSS/kg COD removed | 0.2–0.35 kg TSS/kg COD removed |
| Microplastic removal (S3, 2018-04) | ~1 MP/L in effluent | ~0.4 MP/L in effluent |
| Specific energy | 0.3–0.6 kWh/m³ | 0.5–0.9 kWh/m³ |
| Direct GHG (S3) | 0.85 kgCO2eq/m³ | 0.91 kgCO2eq/m³ |
| Cold-weather nitrification at 10 °C | Often <50% of design | >80% of design (higher SRT retains nitrifiers) |
The microplastic line is worth pausing on. Lares et al. (2018, summarized in S3) measured ~0.4 MP/L in MBR permeate versus ~1 MP/L in CAS effluent — a 2.5× difference that matters for any Blooming Prairie plastics line with a polymer-fine carryover problem or a sustainability target. The GHG line is small (CAS 0.85 vs MBR 0.91 kgCO2eq/m³, per the 2019 plant-wide model in S3) but worth noting for ESG reporting. The cold-weather nitrification row is the line that tips the decision in southern Minnesota: a CAS basin that worked in October will miss NH3 limits in January, while a 30-day-SRT MBR keeps enough nitrifier inventory to stay near design removal at 10 °C. The broader market context behind these numbers is in the 2026 industrial wastewater treatment market outlook.
Fouling, Cleaning and Operator Skills: The Real Operating Difference
Day-to-day MBR operation lives or dies on transmembrane pressure (TMP) management. On rubber and high-polymer feeds, the MDPI 2024 study (S2) recorded a stable operating TMP of 42 ± 4 kPa at 25 ± 4 LMH flux in Phase 1, with a CEB trigger around 50–60 kPa. A typical profile on a Blooming Prairie plastics line looks like: hold 10–30 kPa through the early part of a CEB cycle, climb to 40–60 kPa as foulants accumulate, then trigger a CEB and reset. If you ignore the climb, you will eat a recovery CIP within weeks instead of every 6–12 months.
CEB chemistry is straightforward but not optional:
- 200–500 ppm NaOCl every 1–7 days for organic fouling (latex, polymer, EPS), 30–60 minute soak.
- Citric acid (1–2%) on a weekly or as-needed basis for inorganic scale, especially where sulfate hardness is high.
- Recovery CIP every 6–12 months: ~1,000 ppm NaOCl + acid soak, per membrane maker guidance.
Polymer, latex, and oily additives foul MBR membranes faster than municipal wastewater does. Plan for 20–30% higher air-scour rate than the vendor default, and budget the chemical consumables honestly. The skills gap is real: MBR needs routine TMP/flux logging, permeability trending, and CIP sequencing — usually one trained operator per shift, not the casual-oversight model that many CAS plants run. Plants that skip this step see premature membrane replacement; plants that invest in operator training see 5+ year membrane life on this duty.
Cost, Footprint and Payback for a Blooming Prairie Plant
The financial envelope for a 2026 retrofit of a 200–500 m³/d plastics or rubber line looks like this:
| Cost line | CAS rebuild | MBR retrofit (submerged cassettes) |
|---|---|---|
| CAPEX, installed (200–500 m³/d) | USD 250,000–600,000 | USD 350,000–900,000 |
| OPEX | USD 0.20–0.35/m³ | USD 0.35–0.55/m³ |
| Footprint | 1.0× baseline | ~0.4× baseline |
| Lifecycle cost vs CAS (S2, 2024-06) | Baseline | +17% (vs CAS); +23% vs AnMBR + CAS |
| Install time (skid/containerized) | 3–6 months tankage outage | 4–8 weeks |
The MDPI 2024 lifecycle analysis (S2) is the key data point: ArMBR lifecycle cost runs about 17% higher than CAS and 23% higher than AnMBR + CAS. That premium is real, and it has to be paid back through offsetting savings. A worked sketch for a 300 m³/d plastics line:
- MBR CAPEX premium over CAS rebuild: ~USD 300,000.
- Annual savings on clarifier rebuild, polymer, and sludge hauling: ~USD 80,000/yr.
- Annual water-reuse value (cooling-tower or rinse make-up at ~USD 1.50/m³ on 15–20% of the flow): ~USD 25,000/yr.
- Avoided MPCA noncompliance risk on NH3-N and TSS monthly averages: not zero, and not easily priced, but a single NOAV can exceed USD 50,000.
Add those up and the simple payback lands at 2.8–3.5 years; lifecycle parity with CAS, including membrane replacement and fouling consumables, lands at 4–7 years. That is the same payback band the MDPI authors reference. Skid or containerized MBR delivery compresses install to 4–8 weeks versus a multi-month CAS tankage outage — a real option when the line cannot be down for a quarter. A useful regional comparison sits in the plastics and rubber MBR vs CAS guide for Casa Grande, AZ, which walks the same numbers under different climate and reuse economics.
Decision Framework: When to Pick MBR, When to Stay with CAS
The choice collapses to a few defensible rules once the data is in front of you.
Pick MBR when any of these are true:
- NH3-N discharge limit is <10 mg/L on a monthly average, or your CAS is already missing it in winter.
- Footprint is constrained and you need ≤60% of the CAS basin footprint.
- Water reuse for cooling-tower make-up, process rinse, or scrubber supply is on the roadmap.
- Microplastic or polymer-fine capture is a permit or customer requirement.
- Influent exceeds 5,000 mg/L COD or 200 mg/L NH3-N consistently.
Stay with CAS (or with AnMBR + CAS) when:
- Discharge is to a capable municipal POTW with significant dilution capacity.
- Influent stays below ~2,000 mg/L COD and <100 mg/L NH3-N.
- There is no reuse target and CAPEX is the binding constraint.
- Winter mixed-liquor temperature reliably stays above 12 °C (enclosed heated basins, warm influent).
The hybrid path most Blooming Prairie plants miss: keep the existing CAS aeration basin, drop in an MBR cassette train, and convert in place. The MDPI 2024 review (S2) documents this exact retrofit pattern across the rubber industry, and it sidesteps the long tankage outage of a CAS expansion. A simple rule of thumb closes the framework: if your plastics or rubber wastewater exceeds 5,000 mg/L COD or 200 mg/L NH3-N, MBR belongs on the shortlist. If it does not, CAS remains a defensible choice — but only if the existing basin is in good structural condition and your winter NH3 compliance record is clean.
Frequently Asked Questions
Is MBR worth the +17% lifecycle cost premium over CAS for a plastics or rubber plant in Blooming Prairie, MN?
Usually yes, once you price in avoided clarifier rebuilds, water-reuse revenue, and the cost of missing MPCA NH3-N monthly averages in winter. The MDPI 2024 lifecycle study (S2) puts ArMBR at +17% over CAS and the worked payback for a 300 m³/d line lands at 2.8–3.5 years simple, 4–7 years lifecycle — a band most CFOs will sign off on.
What is the typical effluent quality from a submerged MBR on high-strength plastics or rubber wastewater?
On a properly designed submerged MBR with PVDF flat-sheet UF, expect <30 mg/L COD, <1 mg/L NH3-N at warm mixed-liquor temperatures, 3–8 mg/L NH3-N even at 10 °C, and <5 mg/L TSS — close to the >98% COD removal (22,158 → 118 mg/L) reported in the 2024 MDPI rubber-effluent study. Effluent is typically reuse-ready for cooling-tower make-up or process rinse without further treatment.
Can I retrofit an existing CAS basin in Blooming Prairie with MBR cassettes instead of building new tanks?
Yes, and this is the most common 2024–2026 retrofit path in the rubber industry per the MDPI review. The existing aeration basin is retained, an anoxic zone is added upstream, fine screening (≤2 mm) is added to protect the membranes, and a submerged UF cassette train is installed in the aerobic basin. A skid or containerized MBR delivery compresses install to 4–8 weeks versus a multi-month CAS tankage outage. See the HydropureWater MBR membrane bioreactor system for a typical skid envelope, and the plastics and rubber MBR vs CAS guide for Casa Grande, AZ for a parallel retrofit example.
How does cold Minnesota winter weather affect CAS versus MBR nitrification?
At 10 °C mixed-liquor temperature, CAS typically loses more than half of its design nitrification rate because the slow-growing nitrifier population washes out with the clarifier sludge. A 20–60 day SRT MBR retains enough nitrifier inventory to hold >80% of design nitrification at 10 °C — the structural reason the technology choice tilts toward MBR in southern Minnesota. If your basin stays reliably above 12 °C year-round, the winter argument weakens and CAS remains a defensible option.