Which Limits Actually Control a Kankakee Sewer Discharge?
Plastics and rubber plants near Kankakee meet pretreatment limits by identifying the correct categorical subcategory, characterizing every waste stream, and applying the most stringent applicable requirement among 40 CFR Part 403, the applicable categorical standard, and site-specific local limits. Part 414 governs plastics, resins, and synthetic resins; Part 463 governs rubber manufacturing. The plant’s individual industrial user pretreatment permit, issued by the receiving POTW’s Control Authority, determines enforceable local conditions, monitoring requirements, and the compliance sampling point. Treatment selection should follow those limits, not precede them. The practical sequence is to establish the permit basis, map each process waste stream, characterize batch peaks and pollutant loads, assign unit operations to specific removal duties, then document representative discharge monitoring results.
EPA’s local-limits guidance explains that local limits are site-specific and may be numeric or narrative, including best management practices. The POTW imposes them at the end-of-pipe discharge from the industrial user, meaning the point of connection to the POTW collection system (EPA, “Pretreatment Standards and Requirements—Local Limits,” retrieved 2026-02). This point matters because a permit limit can be violated without a treatment-unit failure: an untested bypass, unrepresentative sample, or batch released outside the monitored flow can still expose the POTW and the discharger.
Pass through occurs when a discharge exits the POTW in quantities or concentrations that, alone or with other discharges, cause a violation of the POTW’s NPDES permit. Interference occurs when a discharge both inhibits or disrupts POTW operations or sludge processes and causes a permit or sludge-use violation (EPA, “Pretreatment Standards and Requirements—Local Limits,” retrieved 2026-02). EPA’s guidance therefore addresses maximum allowable loadings, data collection and analysis, treatment design and implementation, pollutants of concern, and annual reviews and periodic reevaluations. For a Kankakee-area plant, see how industrial plants establish enforceable pretreatment limits.
| Requirement layer | What it establishes | Plant action before design |
|---|---|---|
| 40 CFR Part 403 | General pretreatment requirements, including prohibited discharges, pass through, and interference | Confirm the applicable prohibitions and operational controls |
| 40 CFR Part 414 or 463 | Categorical requirements for the relevant plastics/resin or rubber subcategory | Map production to the correct subcategory and obtain its current limits |
| Individual POTW permit | Site-specific local limits, monitoring point, parameters, frequency, and reporting requirements | Obtain the current permit and local limits from the Control Authority |
| State requirements | Requirements not resolved by the federal permit framework | Verify independently with the applicable Illinois authority |
Map the Plant to the Correct Subcategory
EPA’s process map separates plastics product manufacturing from rubber manufacturing, so facility name or SIC classification alone is not a sufficient basis for choosing a standard. The rubber and miscellaneous plastics products process descriptions include injection molding, extrusion, thermoforming, transfer molding, encapsulation, rubber-product manufacturing, and tire manufacturing (EPA, “Profile of the Rubber and Plastics Industry,” September 1995). These operations also appear in the EPA sector-notebook exhibits, making the process map a practical starting point for a source inventory.
For plastics and resin production, determine whether each stream belongs to contact cooling, process water, emulsion-process wastewater, or another subcategory under Part 414. The HydropureWater pretreatment overview identifies contact cooling and process water under 40 CFR 414.11 and emulsion-process wastewater under 414.21, with other resin-specific subparts also present (HydropureWater, “How Plastics & Rubber Plants Meet U.S. Pretreatment Limits,” retrieved 2026-02). A plant may operate several of these operations, but the permit and applicable categorical subcategories still need to be reconciled through the Control Authority rather than assumed from wastewater appearance.
For rubber operations, distinguish tire production, latex-based processing, and general rubber products such as mechanical, molded, and extruded goods under Part 463 (HydropureWater, “How Plastics & Rubber Plants Meet U.S. Pretreatment Limits,” retrieved 2026-02). EPA’s 1995 sector notebook also shows that rubber-product and tire manufacturing use distinct process steps, which makes source segregation more defensible than treating the entire plant as one wastewater stream.
| Inventory field | Minimum plant-specific entry | Design or compliance use |
|---|---|---|
| Operation and subcategory | Injection molding, extrusion, contact cooling, latex finishing, tire production, or another identified operation | Links the stream to the applicable regulatory and process basis |
| Waste source | Mold wash, kettle clean, contact cooling, emulsion residue, latex finishing, or other source | Identifies contaminant chemistry and segregation potential |
| Operating pattern | Batch or continuous; duration; maximum day and average day | Defines equalization and peak-load requirements |
| Material and chemicals | Polymer or product, release agent, solvent, catalyst, and process additives | Supports targeted characterization and treatment selection |
| Sampling access | Safe access, sample-line suitability, discharge continuity | Supports representative compliance monitoring |
| Treatment route | Source control, DAF, biological treatment, MBR, UF, or controlled disposal | Connects each stream to a defined treatment duty |
Use a plastics and rubber wastewater comparison of DAF and clarifiers while developing that inventory; solids separation is only one part of the decision.
Characterize the Wastewater Before Selecting Equipment
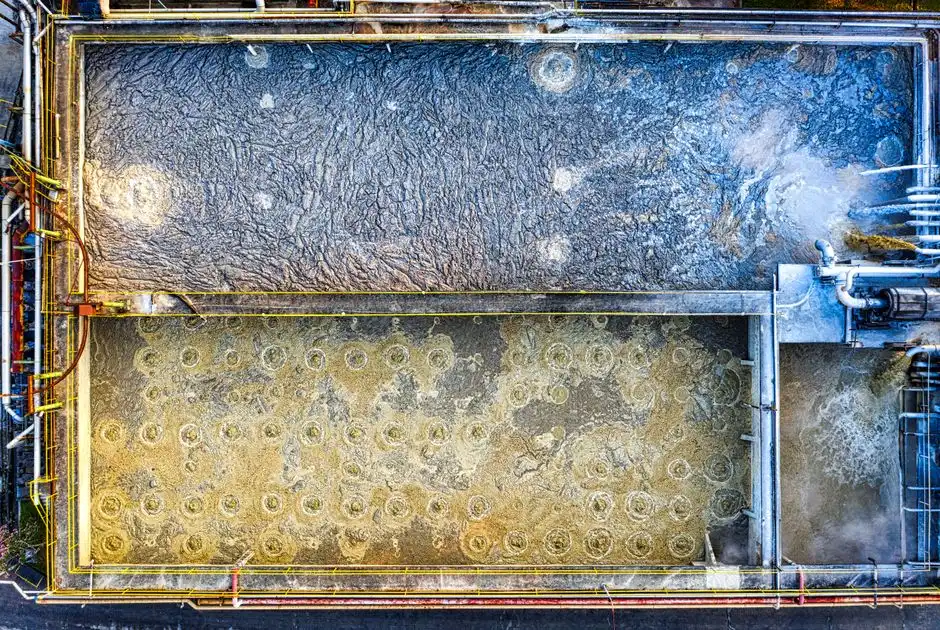
Characterization should be organized around the permit parameters and the chemistry present in each source, not a single all-purpose sampling event. The commercial pretreatment overview identifies TSS, oil and grease, BOD, COD, pH, and process-relevant priority pollutants as recurring discharge-monitoring families, with PFAS screening relevant where fluoropolymers or PFAS-treated feedstocks are present (HydropureWater, “How Plastics & Rubber Plants Meet U.S. Pretreatment Limits,” retrieved 2026-02). The permit determines which parameters, analytical methods, frequencies, and averaging periods actually require reporting.
Use the characterization program to determine whether a pollutant is present, how much is discharged, and whether the discharge is continuous or intermittent. A process-specific scan may need to cover styrene, acrylonitrile, vinyl chloride, benzene, ethylbenzene, anthracene, phenanthrene, and relevant metal catalysts, together with additional compounds identified by the facility’s process chemistry (HydropureWater, “How Plastics & Rubber Plants Meet U.S. Pretreatment Limits,” retrieved 2026-02). These are investigation targets, not automatic permit requirements.
Keep mold-release agents, polymer-coagulant emulsions, latex-finishing residues, oil and grease, and batch kettle-cleaning waste as separate design streams where practical. The commercial source characterizes stabilized polymer-related oil droplets as unusually difficult to remove by gravity separation and identifies DAF as the standard workhorse for that removal duty (HydropureWater, “How Plastics & Rubber Plants Meet U.S. Pretreatment Limits,” retrieved 2026-02). The design consequence is direct: emulsion characterization should occur before deciding whether equalization can safely receive the stream.
Record maximum day, average day, batch peak, flow duration, and solids settleability. Intermittent rubber molding and polymer kettle-cleaning discharges can produce load spikes; the commercial source identifies an undersized or bypassed equalization basin as a cause of enforcement problems (HydropureWater, “How Plastics & Rubber Plants Meet U.S. Pretreatment Limits,” retrieved 2026-02). A measured load profile is therefore more useful than an average flow alone.
| Characterization area | Useful measurement | What it controls |
|---|---|---|
| Conventional loads | TSS, BOD, COD, oil and grease | DAF, biological, and solids-polishing duties |
| Acidity and alkalinity | pH | Permit compliance, chemical compatibility, biological treatment |
| Organic chemistry | Process-relevant priority pollutants | Source control, biological inhibition, treatment suitability |
| Batch behavior | Batch peak, maximum day, average day, flow duration | Equalization and instantaneous treatment capacity |
| Solids behavior | Settleability and solids loading | Hydraulic loading, sludge handling, membrane pretreatment |
| Fluorinated materials | PFAS screening where relevant | Applicable state or permit verification |
The research supports PFAS-monitoring concern for fluoropolymer-related operations, but it does not establish a federal PFAS categorical limit under Part 414 or 463. Any Illinois requirement or permit condition must therefore be verified independently.
Build a Treatment Train That Addresses Each Violation Mechanism
Source reduction and segregation come first because no downstream unit can reliably correct a stream that is incompatible with the treatment process or that should never enter the sewer. Keep polymer-bearing, oily, concentrated, or chemically unusual waste segregated until compatibility and treatment routes are established. Recovery or controlled disposal may be preferable where dilution would disguise the load and increase downstream risk.
Equalization then smooths batch discharges and hydraulic peaks. Do not size it from average flow alone: kettle cleaning, mold washing, and latex operations can concentrate pollutants during short releases. Its mixing and settling behavior must also be checked because one incompatible stream can change the behavior of the entire basin.
DAF has a defined duty: emulsified oil, grease, colloids, and floatable suspended solids. The commercial source identifies DAF as the standard workhorse for stabilized oil droplets and reports 60–90% oil-and-grease removal and 50–80% TSS removal on polymer-bearing streams (HydropureWater, “How Plastics & Rubber Plants Meet U.S. Pretreatment Limits,” retrieved 2026-02). These figures are screening values from the commercial source, not guarantees for every Kankakee-area stream. A dissolved air flotation system for plastics wastewater should therefore be evaluated against measured emulsion properties, peak flow, and the permit limit.
Biological treatment addresses biodegradable organic load after hazardous or inhibitory feeds have been excluded. BOD and COD measurements establish the organic design basis; compare COD and BOD removal technologies before fixing reactor and aeration requirements. An integrated MBR wastewater treatment system combines biological treatment with membrane solids separation where that combination suits the flow, loading, footprint, and effluent objective.
UF is a physical polishing duty for suspended and colloidal material. It does not replace biological treatment for biodegradable BOD or COD. Its value must be tied to a required final TSS or turbidity outcome, the remaining contaminant load, and the pretreatment required to protect the membranes. A UF system for final solids polishing should be selected by required water quality rather than by membrane pore size alone.
| Process position | Primary duty | Decision input | Performance evidence |
|---|---|---|---|
| Source control and segregation | Prevent incompatible or avoidable loads from entering general treatment | Stream chemistry and recoverability | Rejected, diverted, recovered, or treated volume |
| Equalization | Smooth batch and hydraulic peaks | Measured batch profile and load variability | Level, flow, and load records |
| pH adjustment | Meet permit conditions and protect downstream treatment | Influent pH range and process sensitivity | pH at the required monitoring point |
| DAF | Remove emulsified oil, grease, colloids, and floatable solids | Oil and grease, TSS, emulsification, peak flow | Oil and grease and TSS after flotation |
| Biological treatment | Remove biodegradable organic load | BOD, COD, biodegradability, inhibition | BOD and COD after biological treatment |
| MBR | Integrate biological treatment and membrane solids separation | Organic load, solids separation, footprint, discharge target | BOD, COD, and TSS after MBR |
| UF or other polishing | Remove remaining suspended or colloidal solids | Required final quality and upstream solids load | TSS and the permit-specific polishing parameter |
| Authorized reuse or POTW discharge | Deliver the permitted final discharge | Final permit limits and monitoring plan | Representative compliance sample and DMR |
For deeper process context, compare DAF and clarifiers for plastics and rubber wastewater. The actual configuration should be source control → equalization → pH adjustment if needed → DAF → biological treatment → MBR or UF polish → authorized reuse or POTW discharge.
Select DAF, MBR, UF, and Supporting Equipment
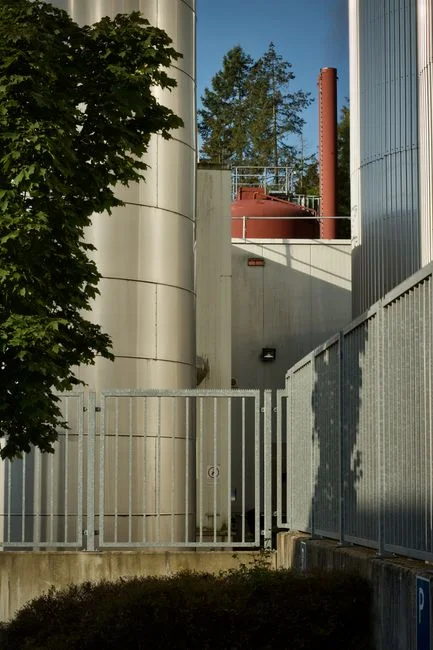
DAF, MBR, UF, and chemical dosing perform different jobs. DAF is the primary option when oil, grease, colloids, or floatable solids dominate. MBR is appropriate where biological treatment and membrane solids separation can be integrated. UF is appropriate for final physical polishing where its required output is justified by the permit or reuse specification. Chemical dosing supports coagulation, flocculation, and pH adjustment; it does not replace the underlying treatment mechanism.
For initial DAF screening, the supplied specification describes microbubble flotation, automatic skimming, and standard capacities from 4–300 m³/h (HydropureWater, “Dissolved Air Flotation System,” retrieved 2026-02). Those are supplier screening values, not a design selection. Actual flow, wastewater chemistry, peak loading, and permit requirements must be confirmed during engineering.
For MBR screening, the supplied specification describes integrated activated-sludge treatment with submerged PVDF membrane filtration and flows from 10–2,000 m³/day (HydropureWater, “MBR Membrane Bioreactor Wastewater Treatment System,” retrieved 2026-02). A sub-1 μm filtration claim is not proof that priority pollutants or dissolved contaminants will be removed; biological removal and membrane solids separation remain separate design duties.
For UF screening, the supplied specification describes 0.03 μm PVDF membranes, 2,000–40,000 L/h, automatic backwash, and air scour (HydropureWater, “Ultrafiltration UF Water Treatment System,” retrieved 2026-02). Confirm solids loading, pretreatment, membrane configuration, cleaning chemistry, and required final water quality before using the range.
Automatic chemical dosing is a support system rather than a universal remedy. The supplier must define the chemical, dose-control logic, mixing condition, residual or consumption measure, and compatibility with the selected process. An automatic chemical dosing system should be evaluated against a verified chemical program rather than assumed to produce DAF performance.
| Equipment | Primary role | Select when | Do not infer |
|---|---|---|---|
| DAF | Oil, grease, colloid, and floatable-solids removal | Measured characteristics show those duties control the risk | That it removes dissolved priority pollutants |
| MBR | Biological treatment plus membrane solids separation | Organic loading and final solids requirements justify the combined train | That filtration alone provides biological removal |
| UF | Final physical solids polishing | A defined TSS, turbidity, or reuse target requires it | That it substitutes for DAF or biological treatment |
| Chemical dosing | Coagulation, flocculation, or pH control | Testing has established the required chemical response | That correct dosing compensates for incompatible wastewater |
The commercial cost comparison states that MBR plus UF was typically 20–40% higher in capital cost than conventional activated sludge plus multi-media filtration, but 15–25% lower in annual operating cost (HydropureWater, “How Plastics & Rubber Plants Meet U.S. Pretreatment Limits,” retrieved 2026-02). That is a screening benchmark only. Actual savings depend on local energy, labor, chemical, and sludge costs.
Prove Compliance at the Designated Sampling Point
The compliance sample must represent the discharge to the POTW, not an intermediate process stream that looks better. The commercial source places the representative sampling point downstream of all in-plant treatment but upstream of any recycle or zero-discharge return (HydropureWater, “How Plastics & Rubber Plants Meet U.S. Pretreatment Limits,” retrieved 2026-02). Confirm the exact location with the permit and Control Authority before installing the station.
Follow the permit’s required sampling point, method, frequency, parameters, and reporting schedule. The commercial source notes that categorical industrial users commonly use 24-hour flow-proportional composite samples for routine monitoring (HydropureWater, “How Plastics & Rubber Plants Meet U.S. Pretreatment Limits,” retrieved 2026-02). For batch discharges, document why the selected monitoring method is representative and ensure the sampling system captures the relevant flow and time period.
Monitoring frequency remains permit-specific. The commercial source describes routine frequencies from twice per year to quarterly, monthly monitoring during some permit-renewal windows, and annual priority-pollutant scans, while stating that the binding permit controls (HydropureWater, “How Plastics & Rubber Plants Meet U.S. Pretreatment Limits,” retrieved 2026-02). Do not adopt a general monitoring schedule when the permit states something different.
Retain chain-of-custody records and correlate each sample with operating conditions, chemical dosages, flow, bypasses, and upsets. A discharge monitoring report should be connected to the treatment record rather than treated as a separate administrative task.
Preventive maintenance, calibrated pH instrumentation, verified equalization performance, and documented bypass prevention are compliance controls. A treatment unit that is offline, bypassed, or maintained only after a violation does not protect the POTW during the unmonitored discharge. review the monitoring-station implications for industrial compliance records before acceptance testing.
Budget, Supplier, and Compliance-Risk Questions to Resolve
Comparable proposals should start with the same design basis: design flow, influent characterization, target pollutants, guaranteed performance, and upstream and downstream treatment assumptions. If two suppliers quote different flows, sampling methods, or upstream exclusions, their prices are not comparable. Ask each supplier to identify whether its performance guarantee is concentration-based, mass-loading-based, or conditional upon specified pretreatment.
Request a total-cost comparison covering equipment, installation, chemicals, energy, sludge handling, monitoring, maintenance, and operator labor. The commercial benchmark that MBR plus UF was typically 20–40% higher in capital cost and 15–25% lower in annual operating cost than conventional activated sludge plus multi-media treatment is a screening direction, not a Kankakee quotation (HydropureWater, “How Plastics & Rubber Plants Meet U.S. Pretreatment Limits,” retrieved 2026-02).
Include permit assumptions, sampling-station provisions, control interlocks, redundancy, training, and commissioning acceptance tests in the scope. Specify how acceptance will demonstrate the permit-relevant outputs: oil and grease after DAF, BOD and COD after biological treatment, TSS after membrane or polishing, and pH at the point required by the permit.
Treat an undersized or bypassed equalization basin, an untreated batch discharge, and nonrepresentative monitoring as compliance risks. These failures can affect the POTW through pass through or interference even when the average laboratory result appears acceptable. For solids handling requirements, include upstream sludge generation and downstream disposal in the comparison; a plate-and-frame filter press may be relevant where dewatering is required, but its selection must follow measured solids characteristics and disposal constraints.
Frequently Asked Questions
What inputs are needed to size treatment for plastics and rubber wastewater near Kankakee?
Use measured maximum and average flow, the batch discharge profile, pollutant loads, required removal performance, and the permit limits. The permit may control peak-discharge or mass-loading conditions even when concentration limits appear manageable. Require the supplier to state which flow and load cases its guarantee covers and which upstream and downstream conditions are excluded.
Should the plant select DAF or MBR as the primary treatment system?
Select DAF when measured oil, grease, colloids, or floatable solids are the controlling removal duties. Select MBR when biodegradable organic loading and membrane solids separation can be combined credibly. A combined train is common when both duties exist: DAF can remove oil and floatable material ahead of biological treatment, while MBR can provide biological treatment and solids separation. The permit and wastewater data determine the arrangement.
How much more does MBR plus UF cost than conventional treatment?
The supplied commercial comparison states that MBR plus UF was typically 20–40% higher in capital cost but 15–25% lower in annual operating cost than conventional activated sludge plus multi-media filtration (HydropureWater, “How Plastics & Rubber Plants Meet U.S. Pretreatment Limits,” retrieved 2026-02). Request a site-specific total-cost proposal covering installation, power, chemicals, sludge, monitoring, maintenance, and labor; no Kankakee price can be inferred from the benchmark alone.
What should a supplier demonstrate to reduce pretreatment compliance risk?
Require a proposal tied to the current permit, the designated local-limit point, the required sampling method, and plant-specific pollutant data. Include control interlocks, bypass prevention, calibrated instrumentation, sampling-station provisions, operator training, and acceptance tests for the permit-relevant parameters. These checks address both the concentration limits and the pass-through or interference mechanisms that can affect POTW operation and sludge quality.