Why Detergent Wastewater Is a Distinct Treatment Problem
Detergent wastewater stacks organic chemical oxygen demand (COD, expressed in mg/L) with surfactant load (LAS/MBAS) and inorganic builders such as phosphates, silicates and carbonates, so the oxygen demand a plant must remove is not the same as the biodegradable BOD fraction that municipal plants are designed around. Generic oily-refinery or graywater playbooks miss this because refinery streams are dominated by emulsified hydrocarbons and laundry graywater is usually dilute; the detergent-manufacturing, surfactant-blending and industrial-laundry case is neither. The 2026-era evidence base for treating this matrix now sits in three places: electrocoagulation studies on high-COD concentrates (Wasit University, 2023), A2O biological monitoring on surfactant-bearing municipal streams (Sci Rep, Apr 2026), and coconut-shell activated-carbon adsorption on laundry wastewater (IJHES, 2026).
The biological evidence makes the matrix problem concrete. A 12-month A2O monitoring campaign from September 2023 to September 2022 held effluent linear alkylbenzene sulfonate (LAS) at 0.22 ± 0.05 mg/L, but effluent nitrate still sat at 13.18 ± 3.7 mg/L — a sign that the anoxic stage ran carbon-limited, which is typical when surfactants are the dominant organic and the readily biodegradable fraction is small (Sci Rep, Apr 2026). That nitrate residue is the practical reason detergent streams cannot be handed to a municipal playbook: the bacteria that degrade LAS do most of their work in the oxic tank, and a poorly tuned anoxic zone leaves a nutrient-compliance gap that an oily-refinery train would never have to solve.
For a process engineer, the takeaway is that the decision tree starts with feed strength, surfactant speciation, and discharge or reuse target, not with a single unit operation. The rest of this article compares the three documented routes on their own operating numbers, then maps them to feed conditions the buyer actually faces in 2026.
Electrocoagulation for High-COD Detergent Concentrates
An aluminium/iron paired-electrode electrocoagulation cell reached 99.5% COD removal and 94.2% oil removal on a 710 mg/L COD feed with 73 mg/L TSS, at 12 kWh/m³, when operated at pH 7, 10.5 V, 50 minutes, 2 cm inter-electrode gap, 12 cm submersion, and 0.5 g/L NaCl supporting electrolyte, with 4 aluminium and 4 iron electrodes in a 2 L cell (Wasit University, 2023). The mechanism is straightforward: sacrificial anodes release Al³⁺ and Fe³⁺, which hydrolyse into coagulant species that neutralise surfactant charge and entrap colloidal organics, while hydrogen bubbles generated at the cathode float the resulting floc to the surface. That electroflotation step doubles as sludge thickening, which is why electrocoagulation is often compared head-to-head with a dissolved air flotation (DAF) system in detergent line audits.
For an industrial specification, the cited operating point is useful as a benchmark but not a turnkey design: it is a single-feed study on a synthetic matrix, and a vendor will still need to confirm the influent COD range, the surfactant type (anionic LAS behaves differently from non-ionic alcohol ethoxylates), the chloride or conductivity of the plant water, the target kWh/m³, and the expected sludge yield before quoting a cell. The 12 kWh/m³ figure is a useful sanity check — surfactant-bearing streams typically run more energy-intensive than oily refinery wastewater at the same COD because the coagulant dose has to be higher to neutralise micellar charge, so any quote that comes in dramatically below 12 kWh/m³ at similar feed strength deserves a feed-chemistry audit. Pretreatment to knock down TSS and a downstream automatic chemical dosing system for pH correction are the two integration points a buyer should pin down early, because both directly move the kWh/m³ figure at scale.
Electrocoagulation earns its place when the feed is batchy, the COD is high (the 710 mg/L benchmark sits at the lower end of what surfactant concentrates can reach after spill and reject streams are combined), and the site has the electrical capacity to run a rectifier bank continuously. It is not the right tool as a standalone polish — the surfactant load leaving an EC cell is usually too variable for a discharge limit on MBAS, which is why the most common train in the literature is electrocoagulation followed by biological polishing.
Biological Treatment: A2O and MBR for Surfactant-Bearing Streams
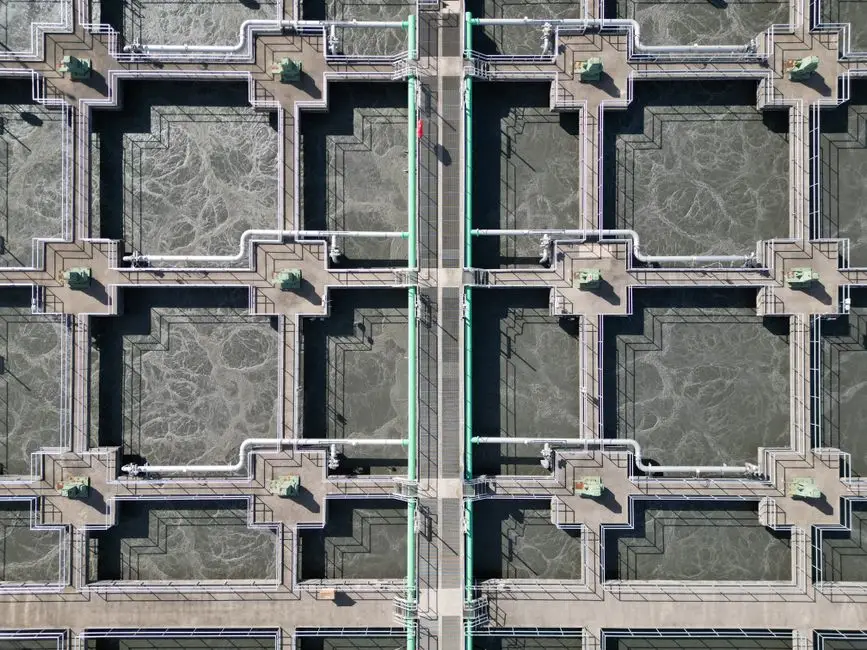
The clearest 2026-era data point on biological removal of surfactants from a continuous stream is a 12-month A2O monitoring study (September 2023 to September 2024) at a municipal plant receiving surfactant-bearing waste; mean final effluent concentrations were 0.22 ± 0.05 mg/L LAS (as MBAS), 13.18 ± 3.7 mg/L nitrate as NO₃⁻-N, and 4.46 ± 0.18 mg/L phosphorus as P (Sci Rep, Apr 2026). The same study found that the oxic tank was the primary site of LAS and phosphorus removal, while the anoxic tank handled most of the nitrate reduction — a process map that transfers directly to an industrial A2O train fed with detergent or laundry waste.
Two engineering implications follow. First, the oxic stage must be sized for the surfactant loading rate, not just for BOD, because LAS oxidation is slower than glucose oxidation and the hydraulic retention time the textbook gives for municipal activated sludge is usually optimistic for surfactant streams. Second, because the anoxic stage ran carbon-limited in the Sci Rep study — leaving 13 mg/L nitrate in the effluent — any industrial A2O that draws its carbon from surfactants alone will likely need supplemental carbon dosing to finish denitrification; methanol or acetate addition is common in this configuration. The 4.46 mg/L effluent phosphorus in the same study is acceptable for many discharge permits but will not meet tight reuse targets without a tertiary chemical precipitation or polishing step.
MBR is the upgrade path when the effluent target approaches reuse water quality. The biological kinetics in an MBR are the same A2O/MBR processes as above, but the membrane adds a physical solids barrier downstream of activated sludge that decouples effluent TSS from sludge settleability — a known weak point for surfactant-fed biomass, which often deflocculates. A buyer specifying a biological backbone for a surfactant stream should think of the MBR membrane bioreactor system as the discharge-limit hedge, with carbon or nutrient polishing added only if the reuse contract requires it.
Adsorption Polishing: Activated Carbon and Fixed-Bed Columns
Coconut-shell activated carbon, activated with 0.1 N HCl, reached 73.30% COD, 71.53% BOD, and 75.73% detergent removal in batch equilibrium tests, with the Freundlich isotherm fitting the data better than Langmuir — a signature of adsorption onto a heterogeneous surface with multiple site energies rather than a single monolayer (IJHES, 2026). In continuous upflow column tests on the same matrix, a 25 cm adsorbent bed gave 97.12% COD, 97.03% BOD, and 99.66% detergent removal, with the longest breakthrough delay of the three depths tested; a 20 cm bed delivered a more balanced average pollutant-load reduction; a 15 cm bed was not competitive (IJHES, 2026).
The IJHES column study also reported a hydraulic conductivity drop from 5.8 × 10⁻⁵ to 3.6 × 10⁻⁵ m/s over the operating period, a direct measure of progressive pore blockage and the leading indicator that media replacement is approaching. For design, the trade-off is clear: deeper beds buy breakthrough time and higher peak removal but compress the cycle between media changes, and the conductivity decline is the metric to instrument. Activated carbon is rarely economical as a standalone primary treatment on raw laundry or detergent wastewater — the surfactant load would saturate the bed in days — which is why the realistic deployment is a tertiary polish downstream of biological or electrocoagulation stages where the feed COD is already in the few-hundred-mg/L range.
For an engineer specifying carbon, the inputs to request from a vendor are: target bed depth and diameter at the design flow, expected empty bed contact time, demonstrated breakthrough curves on the actual feed, planned pretreatment to keep TSS off the media (typically a multimedia filter), and the media replacement interval. The 5.8 × 10⁻⁵ to 3.6 × 10⁻⁵ m/s conductivity drop is the most useful number in the IJHES dataset because it converts directly into a backwash and replacement schedule.
Side-by-Side Comparison of the Three Routes
The table below consolidates the cited performance numbers, the primary operating risk, and the plant profile each route best fits. Every number is taken from the same source line; rows are not interpolated across studies.
| Route | Demonstrated COD / Surfactant Removal | Feed / Operating Conditions (as cited) | Primary Operating Risk | Best-Fit Plant Profile |
|---|---|---|---|---|
| Electrocoagulation (S1, Wasit University, 2023) | 99.5% COD; 94.2% oil | 710 mg/L COD, 73 mg/L TSS, 12 kWh/m³, pH 7, 10.5 V, 50 min, 2 cm gap, 12 cm submersion, 0.5 g/L NaCl, 4 Al + 4 Fe electrodes | Electrode wear and sludge handling | High-strength concentrates, batchy feeds, plants with rectifier capacity |
| A2O / MBR biological (S2, Sci Rep, Apr 2026) | Effluent LAS 0.22 ± 0.05 mg/L; nitrate 13.18 ± 3.7 mg/L; P 4.46 ± 0.18 mg/L | 12-month municipal A2O monitoring, Sept 2023 – Sept 2024; oxic tank is primary LAS and P removal site | Anoxic carbon limitation; aeration energy | Continuous surfactant-bearing streams needing low effluent organics |
| Activated-carbon adsorption (S3, IJHES, 2026) | 25 cm bed: 97.12% COD, 97.03% BOD, 99.66% detergent; 20 cm bed: more balanced load reduction | Coconut-shell carbon, HCl 0.1 N activated, upflow column; hydraulic conductivity fell from 5.8e-5 to 3.6e-5 m/s | Pore blockage and media replacement cost | Polishing prior to reuse or to meet very tight discharge limits |
Read across the rows and the trade-offs appear in one view. Electrocoagulation wins on single-pass COD removal at a known energy cost, but the data are from one feed; biology is the only route with a 12-month field record on surfactant removal, but it leaves a nitrate compliance gap that polishing must close; activated carbon sets the ceiling on detergent removal, but only as a polish because the bed saturates quickly on raw feed.
How to Choose the Right Treatment Train for Your Plant
The three routes are not substitutes; they stack. A decision framework built from the cited evidence looks like this:
| Feed / Discharge Condition | Recommended Primary Stage | Recommended Secondary / Polishing Stage | Key Integration Points to Verify |
|---|---|---|---|
| Very high COD, batchy or spill streams | Electrocoagulation (per S1, 2023) | Biological (A2O or MBR) for residual COD and LAS | Chloride / conductivity management before EC; pH correction via automatic chemical dosing system |
| Continuous mid-strength stream with surfactant and nutrient concerns | A2O or MBR (per S2, Apr 2026) | Optional carbon polish for tight reuse targets | Equalization and screening before biology; supplemental carbon if nitrate is a compliance driver |
| Tight reuse or near-zero effluent targets | A2O / MBR biological | Activated-carbon adsorption column (per S3, 2026) | Multimedia filter ahead of carbon to protect the bed; instrumentation for hydraulic conductivity / breakthrough |
Across all three configurations, the buyer should collect the same baseline data before specifying: influent COD, BOD, LAS / MBAS, TSS, pH, chloride, temperature, and the discharge or reuse limits the plant must hit. Without that input, no quoted kWh/m³ or removal percentage is contractually meaningful. The integration points to verify in any train are equalization and screening upstream of biology or carbon, chloride or conductivity management upstream of electrocoagulation, and sludge dewatering downstream of any of the three — a plate and frame filter press is the workhorse for the small footprint typical of detergent plants, while a multi-media filter is the standard guard bed in front of an adsorption column. For a primer on how the upstream COD and BOD numbers translate into technology choice across industries, the 2026 buyer guide to COD and BOD removal covers the cross-industry view; for a closer look at the flocculant dosing unit engineering guide and the primary sedimentation tank design guide, both link directly into the equalization and pretreatment blocks above.
Frequently Asked Questions
What COD removal can electrocoagulation realistically hit on detergent wastewater?
The Wasit University (2023) study demonstrated 99.5% COD removal at 12 kWh/m³ on a 710 mg/L feed with 73 mg/L TSS under the cited operating conditions. That is a useful benchmark, but the study used a single synthetic feed, so the buyer should request a bench- or pilot-scale test on the actual plant wastewater before committing to cell sizing and kWh/m³ targets.
How do I size a treatment train for an industrial laundry or detergent plant?
Sizing starts with measured data: COD, BOD, LAS / MBAS, TSS, pH, chloride, temperature, and flow, plus the discharge or reuse limits the plant must meet. With those numbers, the decision framework above maps high-COD batchy feeds to electrocoagulation plus biology, continuous mid-strength surfactant streams to A2O or MBR, and tight reuse targets to a downstream carbon polish — but the vendor will not be able to give a defensible equipment list without that data set.
What is the typical lead time and budget range for an electrochemical unit versus an MBR system?
Electrocoagulation skids are generally faster to ship and install than full MBR packages because the equipment list is smaller and membrane modules typically carry the longest lead time on an MBR project. A buyer should request an itemized quote covering cells, rectifiers, controls, membranes, and instrumentation for both options, and then compare on delivered scope rather than a flat per-m³ price; the research does not provide a defensible per-m³ figure for either route.
Can biological treatment alone meet strict discharge limits for surfactant wastewater?
The Sci Rep (Apr 2026) A2O data show effluent LAS at 0.22 ± 0.05 mg/L, which is well below most surfactant discharge limits, but nitrate still sat at 13.18 ± 3.7 mg/L — a sign that polishing, supplemental carbon, or a separate denitrification step is likely needed to meet a tight nutrient limit.
When does activated carbon need to be replaced in a polishing column?
The IJHES (2026) column study reported hydraulic conductivity falling from 5.8 × 10⁻⁵ to 3.6 × 10⁻⁵ m/s as the bed loaded up, alongside earlier breakthrough at the 15 cm depth than at the 25 cm depth. The standard replacement triggers in practice are the rising differential pressure across the bed, falling hydraulic conductivity, and the breakthrough curve of detergent or COD at the outlet — any of which the vendor should be able to translate into a planned media change interval for the actual feed.