Why Fenton Installations Fail Before They Start
Most Fenton commissioning failures are instrumentation and pH-control failures, not chemistry failures — a single pH probe with no redundancy is the most common root cause in audit findings (HydropureWater field data, 2026). Conventional biological treatment loses 40–60% of its rated removal efficiency on fine chemical slug loads and can collapse entirely on a single toxic pulse, which is why Fenton is typically installed as a chemical pretreatment upstream of an MBR (HydropureWater field data, 2025–2026). Scavenging makes the problem worse: at 5–50 g/L salinity and 500 mg/L bicarbonate, radical scavengers consume hydroxyl radicals faster than the target organics can be attacked, so jar tests on synthetic feed overstate COD removal by 30–40 percentage points versus plant effluent (HydropureWater field data, 2026). A defensible install plan has to start from those three operational failure modes, not from the chemistry textbook.
The failure mode that matters most for a project engineer is the silent one. A pH probe drifts to 3.9 over a weekend and the operator sees no alarm; by Monday the iron is precipitating as ferric oxyhydroxide in the reaction tank, the sludge blanket has climbed, the clarifier is choking, and the operator is dumping peroxide into a matrix that can no longer generate hydroxyl radicals. The skid is mechanically fine, the chemistry textbook is fine, the audit finding still goes against the engineer. Build the install plan around preventing that scenario.
The Four Sizing Parameters Every Fenton Reactor Must Lock Down
Fenton reactor sizing collapses to four numbers: pH window, H2O2:Fe2+ molar ratio, H2O2:COD mass ratio, and hydraulic residence time. Get those right and the skid works; get any one wrong and iron and peroxide are dumped for no COD removal (HydropureWater field data, 2026). The pH operating window is 2.5–3.5, with hard limits at 2.0 (•OH yield collapses) and 4.0 (Fe3+ precipitates as ferric oxyhydroxide and H2O2 decomposes to O2). The H2O2:Fe2+ molar ratio operating band is 5:1–30:1; ratios below 5:1 waste Fe as sludge, and ratios above 30:1 leave H2O2 unreacted. The H2O2:COD mass ratio operating band is 1.0–2.5, with a jar-test start of 1.5 covering most pesticide intermediate and dye streams. Radical reaction HRT is 30–45 min, plus 30–60 min for neutralization and floc maturation, and heating is not required for most ambient fine chemical discharges because >45 °C accelerates H2O2 decomposition to O2.
Reactor volume is V = Q × HRT on working volume, not total volume. A 20 m³/h stream at 60 min HRT is a 20 m³ working-volume CSTR — not the 50 m³ vessel some vendors quote. Always confirm in the RFQ whether the quoted HRT is on working volume or total volume; the difference is a 2.5× swing in reactor CAPEX. The four parameters and their hard limits are summarized in the table below; these are the values that must be pinned into the P&ID and PLC logic before the engineer signs off on a reactor volume.
| Parameter | Operating band | Hard limits / notes |
|---|---|---|
| Reaction pH | 2.5–3.5 | < 2.0 •OH yield collapses; > 4.0 Fe3+ precipitates as ferric oxyhydroxide, H2O2 → O2 |
| H2O2:Fe2+ molar ratio | 5:1–30:1 | < 5:1 wastes Fe as sludge; > 30:1 leaves H2O2 unreacted, raises downstream BOD |
| H2O2:COD mass ratio | 1.0–2.5 | Jar-test start 1.5; covers pesticide intermediate and dye streams |
| Radical reaction HRT | 30–45 min | Plus 30–60 min for neutralization and floc maturation; > 45 °C accelerates H2O2 → O2 |
| Reactor volume (working) | V = Q × HRT | Clarify working vs total volume in every RFQ |
| Fe2+ source | Ferrous sulfate heptahydrate | Avoid FeCl3 — adds chloride load |
| Post-reaction pH | 7.0–8.0 | Precipitates Fe(OH)3 before clarification |
Pre-Install Engineering: Jar Tests, Pilot Trials, and P&ID Sign-Off
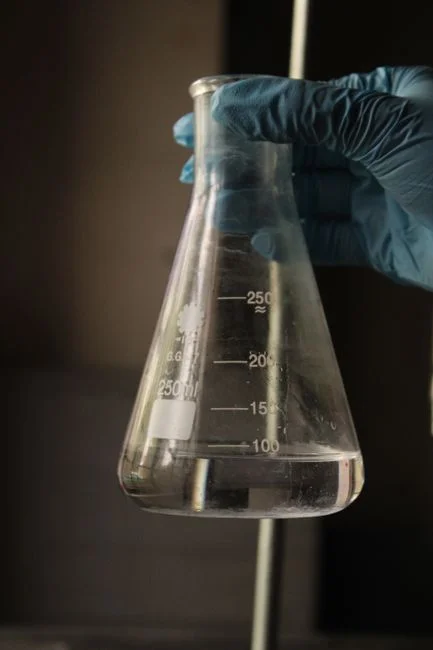
Always run jar tests on actual plant effluent, not a synthetic — at 20 g/L NaCl and 500 mg/L bicarbonate, radical scavenging drops a 90% lab COD removal to under 50% on real plant streams (HydropureWater field data, 2026). The standard Fenton continuous-flow configuration runs acid regulation → catalyst mixing → oxidation → neutralization → solid–liquid separation (IntechOpen, 2023). Pilot at 100–500 L working volume on a continuous side-stream to confirm the •OH yield and the iron-sludge production rate under real chloride and color loadings. The jar-to-pilot-to-scale-up sequence is the only defensible way to size a Fenton reactor because every parameter in the table above is influent-specific.
Lock the four parameters into the P&ID and the PLC before signing off on reactor volume; missing any one is the most common cause of failed performance audits (HydropureWater field data, 2026). Specify ferrous sulfate heptahydrate as the Fe2+ source, and avoid FeCl3 because it adds chloride load to a stream that already has 5–50 g/L salinity from process salts (HydropureWater field data, 2026). Process and equipment context for fine chemical duty is covered in the 2026 Fenton engineering guide for fine chemical wastewater.
Mechanical Installation: Tanks, Mixers, Dosing Skids, and Sludge Handling
316L stainless CSTRs are the standard for flows up to 30 m³/h; FRP- or HDPE-lined carbon steel takes over above that to keep CAPEX in check (HydropureWater field data, 2026). Internal baffles and slow-speed mixers at G-values of 50–200 s⁻¹ keep H2O2 distributed without stripping the dissolved oxygen that scavenges •OH. Two-stage pH adjustment is the standard configuration: 98% H2SO4 down to 2.5–3.5 for the reaction, then 30% NaOH or lime slurry up to 7.0–8.0 to precipitate Fe(OH)3 before clarification. The acid and base dosing pumps are typically delivered as PLC-controlled chemical dosing skids with redundant pH probes and calibrated flowmeters already mounted and loop-tested.
Plan iron-sludge handling from day one, because the OPEX of sludge disposal typically exceeds the chemical cost on a Fenton train. Yield is 1.5–3.0 kg of Fe(OH)3 per kg of H2O2 dosed, so a 20 m³/h plant at 200 mg/L H2O2 generates 480–960 kg/day of wet ferric sludge (HydropureWater field data, 2026). After a lamella thickener that sludge sits at 92–96% moisture; a plate-and-frame filter press dewaters Fenton iron sludge to 35–45% dry solids, which is landfillable in most jurisdictions. If the sludge-handling scope is not in the RFQ, the plant will be running a sludge lagoon within six months of startup.
Instrumentation and Safety Interlocks Before Live Feed
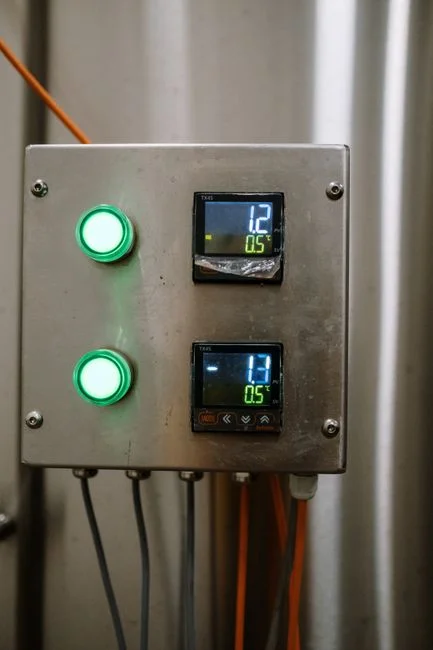
Inline ORP control on the reaction tank, targeting +350 to +500 mV versus Ag/AgCl, gives a real-time read on the Fe2+/Fe3+ balance and lets the PLC trim H2O2 feed before COD removal drifts (HydropureWater field data, 2026). Redundant pH probes on both the acid-side and base-side dosing loops are mandatory; a single pH probe with no redundancy is the single most common cause of failed Fenton performance in audit findings (HydropureWater field data, 2026). Wire H2O2 feed interlocks to both the acid and base dosing pumps so a pH excursion cannot dose peroxide into the wrong matrix — peroxide dumped into a non-acidic stream is the classic Fenton fail mode, and the interlock is cheap insurance against it.
Automatic dosing skids for H2O2 and Fe2+ feed with redundant pH and ORP probes are the standard skid-builder approach, and online COD analyzers on the Fenton reactor outlet are worth specifying if the reactor handles variable batch loads (HydropureWater field data, 2026). Trip-test every interlock during the water-test phase of commissioning so the interlock logic is proven before any H2O2 is on site.
Stepwise Commissioning: Water Test, Simulated Feed, and Performance Acceptance
Phase 1 is a water test. Fill the reaction, neutralization, and clarifier tanks with clean water; verify every dosing pump against calibrated flowmeters; trip-test every interlock before any chemical is introduced. Phase 2 is simulated feed. Dose H2SO4 and Fe2+ against water first, then introduce H2O2 at 25% of design rate and ramp while monitoring ORP and pH response curves. Phase 3 is live effluent. Step-feed plant effluent at 25%, 50%, 75%, and 100% of design flow with H2O2:COD held at the jar-test-confirmed ratio; hold each step for at least two HRTs before stepping up so the system reaches steady state at each loading.
Acceptance criteria on dye or pharma API wastewater are 50–80% COD removal at H2O2:COD 1.0–2.5 and 30–120 min HRT, with BOD/COD lifted from below 0.2 to 0.3–0.4 (HydropureWater field data, 2026). Document iron-sludge yield against the 1.5–3.0 kg Fe(OH)3 per kg H2O2 band before signing the performance certificate — a yield above the band is a chemistry-tuning problem; a yield below the band means the iron is leaving in the clarifier overflow. The clarifier is typically a high-efficiency lamella clarifier sized for the Fenton floc load and the variable TSS that comes out of the neutralization step.
Vendor Selection and 2026 CAPEX Benchmarks
Filter vendors on five criteria: jar-test pilot data on actual plant effluent, in-house ORP and redundant pH instrumentation, PLC/SCADA integration to plant DCS, FRP or 316L construction appropriate to chloride exposure, and at least three proven fine chemical references in the past 24 months (HydropureWater field data, 2026). Any quote below $40,000 for a 20 m³/h scope should trigger a scope-of-supply review — at that price point the clarifier, the dosing skids, or the PLC package is missing from the deliverable. 2026 turnkey skid CAPEX for 5–50 m³/h systems runs $40,000–$150,000 depending on materials of construction, instrumentation, and whether the clarifier and chemical dosing packages are included (HydropureWater field data, 2026).
Clarify in the RFQ whether HRT is based on working volume or total volume; vendors quoting 50 m³ for a 20 m³/h stream are using total volume, not working volume, and the engineer pays for that capacity twice. Classical Fenton OPEX lands at $0.80–$2.50/m³, dominated by H2O2 at $0.30–$0.80 per kg with sludge disposal and NaOH/H2SO4 neutralization chemicals adding another 20–30% (HydropureWater field data, 2026). For most fine chemical sites, the next skid downstream is downstream MBR polishing to tighten the final effluent to discharge-consent levels.
| Cost line | 2026 band | Notes |
|---|---|---|
| Turnkey skid CAPEX (5–50 m³/h) | $40,000–$150,000 | Depends on materials, instrumentation, clarifier/dosing scope |
| Classical Fenton OPEX | $0.80–$2.50/m³ | Dominated by H2O2 at $0.30–$0.80/kg |
| Sludge disposal + neutralization | +20–30% on OPEX | NaOH/H2SO4 plus iron sludge landfill |
| Quote below $40,000 for 20 m³/h | Scope-of-supply review required | Clarifier, dosing skids, or PLC typically missing |
Frequently Asked Questions
What pH window should I lock into the P&ID for a Fenton reactor?
Reaction pH must be held between 2.5 and 3.5; outside that band, iron precipitates as ferric oxyhydroxide and H2O2 decomposes to O2 instead of hydroxyl radicals (HydropureWater field data, 2026).
What H2O2:Fe2+ molar ratio should I specify for a pesticide intermediate stream?
Start jar tests at 15:1 and bracket 5:1–30:1; below 5:1 iron sludge dominates the OPEX, and above 30:1 residual H2O2 bleeds into the biological step and raises downstream BOD (HydropureWater field data, 2026).
What is the 2026 CAPEX band for a 20 m³/h Fenton skid, and what should I watch for in a low quote?
Turnkey skid CAPEX for a 5–50 m³/h system sits at $40,000–$150,000 in 2026, depending on materials, instrumentation, and whether the clarifier and dosing packages are included (HydropureWater field data, 2026). A request for quotation that comes in below $40,000 for a 20 m³/h scope should trigger a scope-of-supply review — at that price point the clarifier, the dosing skids, or the PLC package is typically missing from the deliverable.
How do I filter Fenton skid vendors before issuing a purchase order?
Filter vendors on five criteria: jar-test pilot data on actual plant effluent, in-house ORP and redundant pH instrumentation, PLC/SCADA integration to plant DCS, FRP or 316L construction appropriate to the chloride exposure, and at least three proven fine chemical references in the past 24 months (HydropureWater field data, 2026).