What WWTP Optimization Actually Means in 2026
US municipal wastewater treatment plant optimization in 2026 means deploying continuous, real-time monitoring at the influent, aeration basin, and effluent, then using analytics to drive aeration control, chemical dosing, and flow balancing. Plants that do this shift from reactive to predictive operations, cut aeration energy — typically the largest single power load at a WWTP — and maintain continuous NPDES discharge compliance instead of relying on grab sampling.
Optimization in this sense is the combination of three things working together: the physical treatment equipment (screens, basins, blowers, membranes, UV, dewatering units), continuous monitoring sensors feeding data into a control system, and analytics that turn that data into setpoint changes. It is not a software license, not a one-time equipment swap, and not a SCADA upgrade on its own — those are necessary pieces, not the whole loop. A plant can own every sensor on the market and still miss the optimization target if the readings are not closing a control loop on a blower vane or a polymer pump.
US municipal plants are measured against three KPI families, and a 2026 optimization plan should explicitly call them out. First, regulatory compliance: NPDES permit limits on five-day carbonaceous BOD (CBOD), total suspended solids (TSS), ammonia-nitrogen, pH, residual chlorine, and — in nutrient-impaired watersheds — total nitrogen and total phosphorus, with PFAS and other constituents of emerging concern showing up in a growing number of state permits. Second, energy: aeration typically accounts for 50–60% of a plant's electricity use, so dissolved-oxygen (DO) control is the single largest savings lever available to operations. Third, operations: uptime, chemical consumption per m³ treated, and the cost of moving sludge through dewatering. Most US plants were designed and built decades ago with limited instrumentation and manual, inspection-based maintenance, so failures are typically discovered reactively after service disruption or a regulatory excursion (per Eficens, 2026). Continuous monitoring plus analytics is what converts that plant from reactive to predictive — which is the baseline expectation in 2026 from both state regulators and from the utility's own board.
The Three Monitoring Layers Every US Plant Needs
An audit-ready 2026 monitoring program has three physical layers plus a network layer, and most US plants have a coverage gap in at least one of them. The three plant-side layers are influent, aeration basin / biological, and effluent / outfall; the network layer covers lift stations, trunk sewers, and outfall level sensors that let operators see what is arriving at the plant before it arrives.
Layer 1 — Influent monitoring — is continuous flow and quality measurement on raw wastewater entering the plant, used to inform chemical dosing, balance diurnal and storm-driven variability, and protect downstream biological treatment. Per Badger Meter's municipal wastewater framing, influent monitoring is the basis for both chemical dosing decisions and overall operational efficiency, and it is the layer that makes everything downstream possible: if you cannot characterize the load, you cannot dose or aerate against it.
Layer 2 — Aeration basin and biological treatment — is where the largest energy and compliance lever sits. Continuous dissolved oxygen, ammonia, MLSS/MLVSS, and oxygen uptake rate (OUR) data drive BOD removal and nitrification and let the blower control loop track real load instead of running at a fixed air setpoint. Layer 3 — Effluent and outfall — uses continuous pH, turbidity, TSS, nutrient, and (where required) emerging-contaminant analyzers to produce the continuous compliance evidence that NPDES reporting now expects from major discharges. The network layer — lift-station flow, pump cycling, sewer level, and outfall sensors — is what lets a plant see inflow/infiltration and wet-weather impacts in time to act instead of after the hydraulic surge has already passed through the headworks (per Eficens, 2026).
| Layer | Typical Sensor Set | Primary Purpose | Typical Coverage Gap at US Plants |
|---|---|---|---|
| Influent (raw wastewater) | Magmeter or flume flow, pH, conductivity, TSS, COD/BOD online, temperature | Load characterization, diurnal and storm variability, chemical-dosing trim | Online BOD/COD often missing; flow accuracy drifts without calibration |
| Aeration basin / biological | DO (multiple probes per basin), ammonia, MLSS/MLVSS, OUR, nitrate | Close aeration and nitrification control loops; protect BOD and ammonia compliance | Single DO probe per basin; no ammonia or OUR feedback |
| Effluent / outfall | pH, turbidity, TSS, ammonia, nitrate, residual chlorine or UV transmittance | Continuous NPDES evidence; early excursion detection | Grab-sample-only; no continuous TSS or ammonia at outfall |
| Network (lift stations, sewer, outfall) | Lift-station level and pump current, sewer level/flow, outfall level | Inflow/infiltration visibility, wet-weather response, blockage detection | Manual inspection only; no remote alarms |
Process Parameters and KPI Targets to Track
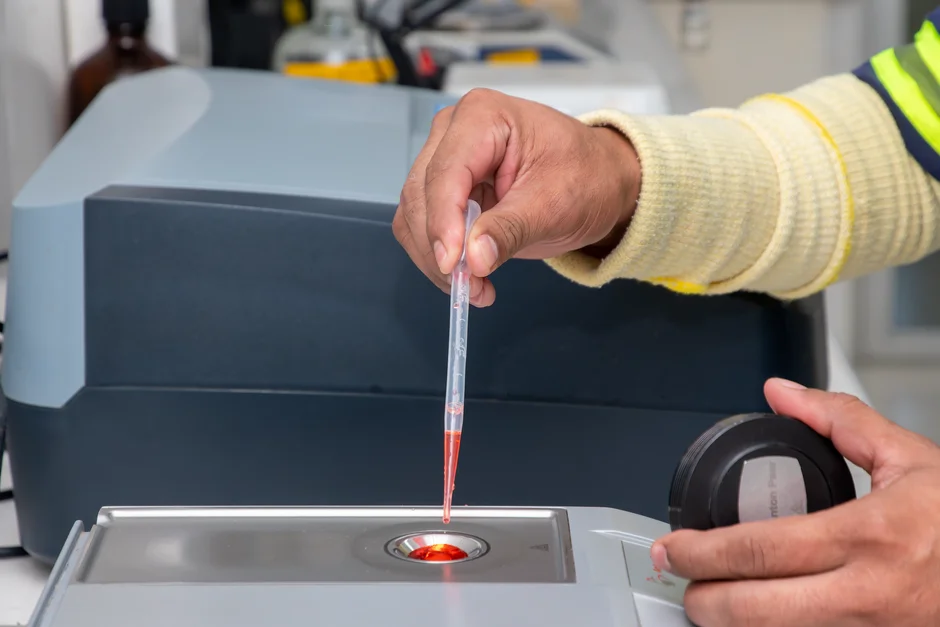
Engineers planning a 2026 optimization project need concrete parameters to put in front of a vendor or a state regulator. The table below consolidates the standard design parameters for a conventional activated-sludge plant and the KPI ranges the monitoring system should continuously verify; the exact numeric setpoint depends on permit limits, temperature, and influent load, so the engineering job is to instrument the parameter, not to copy a single number from a textbook.
For the aeration basin, the operating envelope is described by a dissolved-oxygen setpoint window (typically tuned between roughly 1.5 and 2.5 mg/L for conventional activated sludge, lower for high-rate and higher for nitrification stages), an MLSS/MLVSS operating range that keeps the mixed liquor in a settlable and respiring band, a sludge retention time (SRT) window long enough to retain nitrifiers at winter temperatures, an F:M ratio matched to the plant's load, and a hydraulic retention time (HRT) sized to the basin volume. For effluent KPIs, the monitoring system should continuously verify that the secondary-treatment train is meeting the plant's NPDES expectations for BOD, TSS, ammonia, and pH, framed as ranges the operator watches, not as fixed targets. The energy KPI is aeration kilowatt-hours per unit of pollutant removed — kWh per kg BOD removed or per kg ammonia oxidized — which is the standard internal metric utilities use to compare optimization projects year over year. Chemical and sludge KPIs (coagulant or polymer dose per m³, sludge volume index, percent solids after dewatering) close the loop to solids handling, so a gain on the liquid stream does not create a bottleneck on the cake side.
| Parameter / KPI | Typical Range or Window (Conventional Activated Sludge) | What Continuous Monitoring Tells the Operator |
|---|---|---|
| Dissolved oxygen (DO) setpoint | ~1.5–2.5 mg/L (conventional); tuned for nitrification stage | Whether aeration is over- or under-supplied; flags probe failure |
| MLSS / MLVSS | Designed operating range; MLVSS typically 60–80% of MLSS | Whether wasting rate is keeping biomass in the operating band |
| SRT | Long enough to retain nitrifiers at minimum winter temperature | Risk of nitrification loss during cold weather or wet-weather peaks |
| F:M ratio | Low-rate for nitrification, higher for carbon-only BOD removal | Whether the basin is treating the load it actually sees |
| Effluent BOD / TSS / NH₃-N / pH | Continuously verified against NPDES permit limits | Real-time compliance margin; excursion root cause |
| Aeration energy intensity | kWh per kg BOD removed or kg NH₃-N oxidized (internal benchmark) | Year-over-year energy efficiency; project payback evidence |
| Chemical dose (coagulant / polymer) | kg per m³ treated (plant-specific) | Over-dose waste, under-dose compliance risk |
| Dewatered cake solids | Percent dry solids after press or centrifuge | Sludge handling cost; downstream digester or disposal mass |
Architecture Choices: SCADA, Edge Analytics, and Cloud Platforms
The architecture decision is where most procurement conversations go sideways, because SCADA, edge analytics, and cloud platforms are usually presented as competing products when in practice they are three layers of the same stack. The right question is which layer closes which control loop, and what the plant's IT and cybersecurity posture will tolerate.
A SCADA-first architecture is the legacy default at most US plants: strong for alarms, motor control, and local HMI operation, weaker for cross-plant trend analytics, predictive maintenance, and the long-term data retention that a state energy-reduction program or an NPDES auditor will eventually ask for. An edge analytics layer — analytics running on a PLC, RTU, or industrial edge controller — closes the fast control loops that cannot tolerate cloud latency: aeration DO control on a 1–5 second update, polymer dose trim on a flow-proportional signal, and storm-mode flow balancing. This layer is also where plants with constrained IT posture or tight cybersecurity requirements keep their decisions, because the loop closes locally and does not depend on outbound internet. The cloud platform layer handles long-term trending, multi-plant benchmarking, and ML-based anomaly detection, and it is almost always layered on top of an existing SCADA system rather than replacing it. The Eficens point that should govern every architecture decision: sensor data is only operationally valuable when it is integrated into maintenance and operations workflows — SCADA alarms, CMMS work orders, and aeration control logic. Cities that deploy sensors but do not connect monitoring outputs to operational workflows see limited value, because the data never reaches the person who can act on it (per Eficens, 2026).
2026 Compliance and Funding Anchors US Plants Should Plan Around
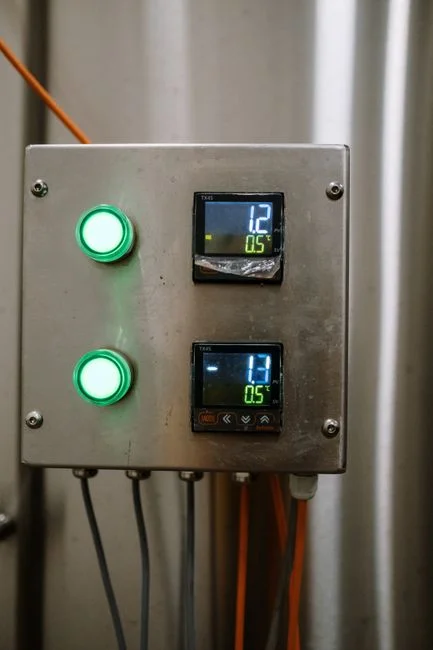
Three regulatory and funding drivers should appear explicitly in any 2026 optimization plan a US municipal engineer puts in front of a state regulator or a funding agency. The first is the NPDES permit itself: continuous monitoring is increasingly replacing grab sampling as the primary evidence of compliance for major discharges, and a plant that can show continuous pH, DO, ammonia, and TSS streams is in a stronger position during a permit review than a plant that can only produce a weekly composite. The second is nutrient and emerging-contaminant pressure: many US permits are tightening on total nitrogen, total phosphorus, and in some watersheds on PFAS, 1,4-dioxane, and other constituents of emerging concern — a driver for richer sensor stacks rather than a single rule to wait for. The third is energy and GHG visibility: aeration-driven electricity is increasingly reported to state energy-reduction programs and to utility-level GHG inventories, which means an aeration-control project has a documented energy narrative that state programs and federal funding mechanisms are willing to score.
On the funding side, federal and state clean water funding programs — including the Clean Water State Revolving Fund (CWSRF) and infrastructure-bill-era programs for emerging contaminants — preferentially score projects with documented monitoring and performance verification. An optimization plan that bundles a sensor layer with the control-loop upgrade is easier to fund and easier to defend at the post-project audit than a controls-only or equipment-only scope. For a broader view of how these constraints shape a project outside the US, this engineering blueprint of a municipal sewage treatment plant in Kano Nigeria shows how the same KPI families drive planning in a different regulatory environment.
Mapping Optimization to the Physical Plant: Sensor and Equipment Checklist
The translation from monitoring layer to physical equipment is the part of the plan that procurement actually signs off on, so it is worth laying out stage by stage. The list below is the checklist a 1–50 MGD plant should walk through when scoping a 2026–2028 optimization project, paired with the equipment categories that close each loop.
- Headworks. Mechanical screening protects every downstream unit. A rotary mechanical bar screen on the inlet channel, paired with flow and level instrumentation, removes debris that would otherwise foul aeration diffusers, plug membranes, and overload the primary clarifier.
- Pre-treatment and primary clarification. A dissolved air flotation (DAF) unit is the right tool for high-solids or FOG loads, and a PLC-controlled chemical dosing skid tied to influent flow and quality signals lets coagulant and flocculant dose track load instead of running at a fixed pump setting.
- Biological stage — the optimization focus. DO and ammonia sensors in the basin feed the aeration blower control loop; an MBR membrane bioreactor system is the configuration to consider when the plant needs near-reuse effluent quality or a smaller footprint than conventional activated sludge can deliver.
- Disinfection. A pipeline UV sterilizer is the choice for chemical-free, chlorine-resistant organism control; where residual disinfection is required by permit, a chlorine dioxide generator covers the residual side without the THM formation risk of free chlorine.
- Solids handling. A plate and frame filter press closes the mass-balance loop, so optimization of the liquid stream does not create a sludge bottleneck. For plants already operating dewatering units, the disc filter retrofit and upgrade guide covers a common tertiary-stage upgrade, and the sludge dryer installation and commissioning guide covers the downstream end of the cake-handling train.
| Treatment Stage | Sensor to Add or Verify | Equipment Category | Loop the Sensor Closes |
|---|---|---|---|
| Headworks / inlet | Flow, level, pH, TSS | Rotary mechanical bar screen | Screen differential; flow-paced chemical dose |
| Primary / pre-treatment | Flow, TSS, FOG load indicator | DAF unit, PLC-controlled chemical dosing skid | Coagulant/polymer dose vs. load |
| Aeration basin | DO (multiple), NH₃-N, MLSS/MLVSS, OUR, NO₃ | Blower / aeration control, optional MBR membrane bioreactor system | Aeration energy vs. ammonia and BOD compliance |
| Disinfection | Residual chlorine or UV transmittance, pH | Pipeline UV sterilizer, chlorine dioxide generator | Dose vs. effluent microbial target |
| Solids handling | Flow, cake solids %, polymer residual | Plate and frame filter press | Polymer dose vs. cake dryness target |
| Effluent / outfall | pH, turbidity, TSS, NH₃-N, NO₃ | Online analyzer panel, telemetry to SCADA | Continuous NPDES compliance evidence |
Frequently Asked Questions
Where should a US municipal plant start its optimization project in 2026?
Start at the aeration basin. Aeration typically accounts for 50–60% of a plant's electricity use, and DO and ammonia sensors feeding the blower control loop give the fastest measurable payback in both energy and ammonia compliance. Add continuous influent flow and quality on the same project scope so the aeration loop has the load signal it needs to track real variability.
How does aeration analytics pay back?
Continuous DO control replaces fixed air setpoints with demand-based blower output, reducing kWh per kg BOD removed or per kg ammonia oxidized — the standard internal energy intensity metric utilities use to score projects. The same sensors that drive the energy savings produce the ammonia and DO records that support continuous NPDES compliance evidence.
What should be continuously monitored to support NPDES compliance?
At minimum, continuous pH, DO, ammonia, and TSS at the effluent or outfall, plus continuous flow and load measurement on the influent side for mass-balance reporting. Where the permit includes nutrients or residual chlorine, those analyzers go on the same continuous stream rather than on a grab-sample schedule.
What can a small plant realistically do first on a tight capital budget?
Instrument the aeration basin with DO and ammonia probes tied into the existing SCADA, and add continuous flow and level at the headworks. That single scope closes the largest energy and compliance loop, fits within a CWSRF or infrastructure-bill-era funding application, and produces the performance data needed to justify the next stage of the project.