
Why Adhesive Wastewater Needs a Tertiary Oxidation Step
MBR effluent on a water-based adhesive line can look clear at 5–15 NTU and still fail the audit. The reason is the residual fingerprint the biological stage cannot touch: formaldehyde and isothiazolinone biocides at 0.5–10 mg/L, plasticizers (DOP, DINP), and polymer fractions from PVAc, EVA, acrylic, and SBR emulsions dosed at 0.5–5% solids. Hot-melt operations contribute terpene and rosin condensates; PSA wash lines contribute toluene, ethyl acetate, and heptane (per Operators Unlimited, 2026; S3). Activated sludge and MBR together remove up to roughly 85% of bulk organics on these recalcitrant streams, yet MBR effluent still carries 15–40% of influent COD as non-biodegradable residual, dominated by formaldehyde, solvents, and polymer residuals (per Axine Water Technologies, 2026; S3). The root cause is emulsion stability: anionic and non-ionic surfactants hold polymer particles below 1 µm, slip past primary clarification, and foul MBR membranes, which is why the AOP must sit downstream of the MBR, not upstream. The regulatory floor that closes the design conversation: 40 CFR Part 414 (OCPSF) for U.S. adhesive and sealant plants, EU IED 2010/75/EU BAT-AELs above the EU capacity threshold, India CPCB ZLD at Kanpur and Vatva, and China tightening GB VOC discharge limits in 2026 — direct discharge is no longer the default in any of the four (S3).
How Ozone Oxidation Actually Works on Adhesive Matrices
Two pathways do the work, and only one of them is the actual target. Direct molecular ozone (oxidation potential 2.07 V) reacts with unsaturated C=C bonds via cycloaddition, with aliphatic amines via electrophilic addition, and with aromatic rings via electrophilic substitution (per MDPI 2025; S5). The indirect pathway generates the hydroxyl radical (•OH) at standard reduction potential ~2.8 V, the second strongest oxidant after fluorine, and the •OH pathway is 1.35× more reactive than molecular ozone and non-selective (per MDPI 2025; S3). The pH of the contactor is the dial that shifts the pathway: alkaline conditions (pH 7–9) accelerate O₃ self-decomposition into •OH, which is the principle the peroxone process (O₃/H₂O₂) exploits by adding H₂O₂ to push radical yield (per MDPI 2025; S5). Scope limit worth pinning to the wall before any pilot: ozone and ozone-based AOPs do not destroy ammonia, perchlorate, selenate, or fully halogenated compounds (PFOS, carbon tetrachloride) — those streams need PAC/GAC, ion exchange, RO, or anaerobic biological polishing (per MDPI 2025; S5). The two by-product risk windows that show up on adhesive effluent are bromate formation under alkaline O₃ if the raw water carries even low mg/L bromide, and aldehyde/carboxylic-acid partial-oxidation products when UV/H₂O₂ runs on UV-transparent solvent rinses (S3, S5).
Dose Envelope by Adhesive Sub-Stream
This is the section most engineers will bookmark. The dose envelope is sub-stream specific because the matrix drives radical demand and scavenging. The table below distills the four adhesive sub-streams into the parameter set you paste into a jar-test protocol, then into a full-scale design.
| Sub-stream | Target pH | O₃ dose & H₂O₂ ratio | Residence / reaction | Expected removal band | Reuse potential |
|---|---|---|---|---|---|
| Water-based emulsion (PVAc / acrylic / EVA / SBR) | 5–9 (avoid •OH scavenging at extremes) | 0.5–2 kg O₃/h on 50–100 m³/h; H₂O₂:O₃ 0.3–0.5 mass (per Axine, 2026) | Contactor 10–20 min; EAOP current density per jar test | 60–77% CODcr; 60–62% TOC (Korean 2024, via S3) | Partial — cooling-tower make-up possible |
| PSA solvent wash (toluene, EtOAc, heptane) | 7–9 peroxone; 5–7 EAOP | Peroxone H₂O₂:O₃ 0.3–0.5; EAOP at vendor current density | 10–20 min contactor; EAOP per influent COD | Sub-ppb residual; up to 90%+ on comparable API streams with EAOP (per Axine, 2026) | 30–60% freshwater offset as cooling-tower make-up (S3) |
| Biocidal CIP rinse (formaldehyde, isothiazolinones) | 7–9 peroxone; 5–7 EAOP | Site-specific by jar test; EAOP modular 32–135 m³/day cabinets sized to COD and target PNEC | Residence defined by influent COD and PNEC | EAOP reliably hits sub-ppb PNEC; O₃/H₂O₂ and UV/H₂O₂ leave aldehyde/carboxylic-acid by-products (S3) | High when EAOP selected |
| Hot-melt terpene/rosin condensate | 7–9 | O₃/H₂O₂ at elevated H₂O₂; ORP-trimmed dose | 10–20 min contactor | Volatile fractions skew BOD/COD; site-specific removal band | Limited without RO polish |
Realistic expectation band: a textile ozone-AOP case study documented up to 80% COD reduction on a comparable polymer-dye stream, and O₃/H₂O₂ and UV/H₂O₂ on real effluents reach 60–77% CODcr (per WaterAndWastewater, 2026; Korean 2024, via S3). For the highest matrix load — polymer emulsion plus biocides — only EAOP reliably reaches sub-ppb PNEC residuals without leaving partial-oxidation by-products (per Axine, 2026). The single most common error on adhesive retrofits is extrapolating municipal ozone doses onto emulsion matrices; do not skip the jar test (S3).
O3/H2O2, UV/H2O2, Fenton, or EAOP: A Side-by-Side Comparison
Three inputs decide the family: (1) target residual COD, (2) reuse intent, and (3) the site's ability to handle hazardous chemicals and off-gas. The matrix below places all four AOP families against the same six columns so the procurement and engineering teams can sign the same page. The DAF pre-treatment skid that feeds this train is the unit operation that breaks the emulsion ahead of the AOP — without it, the dose envelope above does not hold.
| Family | Removal band | pH window | Hazardous inputs | Off-gas / waste | Footprint | Best-fit adhesive sub-stream |
|---|---|---|---|---|---|---|
| O₃/H₂O₂ (peroxone) | 60–77% CODcr; 60–62% TOC (Korean 2024, via S3) | 7–9 | O₃ (destruct + LEL + scrubber); H₂O₂ 35–50% w/w storage | O₃ toxic off-gas; H₂O₂ tank farm | Large — contactors + tank farm | PSA solvent wash, biocide rinse |
| UV/H₂O₂ | 60–77% CODcr; partial-oxidation aldehydes/carboxylic acids possible | 5–9 | Mercury-lamp disposal (RCRA universal waste); H₂O₂ storage | None significant; lamp disposal | Medium — UV reactor banks + dosing | UV-transparent solvent rinses where mercury is already in site hazardous-waste program |
| Fenton / photo-Fenton | 50–70% COD on real effluents; strong on polymer color and BOD | 2.8–3.2 reactor; neutralize to 7 | FeSO₄; H₂O₂; HCl/H₂SO₄; lime/NaOH | Iron sludge | Medium — reactor + sludge thickener | Polymer-emulsion color and BOD rather than VOC |
| EAOP (BDD/MMO anode) | Up to 90%+ on comparable API streams with full mineralization (per Axine, 2026) | 5–7 | None external | None liquid or solid hazardous | Modular 32–135 m³/day cabinets, skid-mountable | Sub-ppb PNEC and 30–60% reuse credit |
Decision rule: if reuse is not on the table and the local POTW is forgiving, O₃/H₂O₂ at 60–77% CODcr removal is the lowest CAPEX, but budget for ozone destruct, LEL monitor, and a 35–50% w/w H₂O₂ tank farm with bunding. If reuse is required and the local discharge limit is sub-100 mg/L COD with VOC constraints, EAOP is the established path: it mineralizes without off-gas or mercury, and the modular cabinets can sit at decentralized CIP rinse headers rather than at a central end-of-pipe location (per Axine, 2026).
Where the Ozone Skid Sits in the Process Train
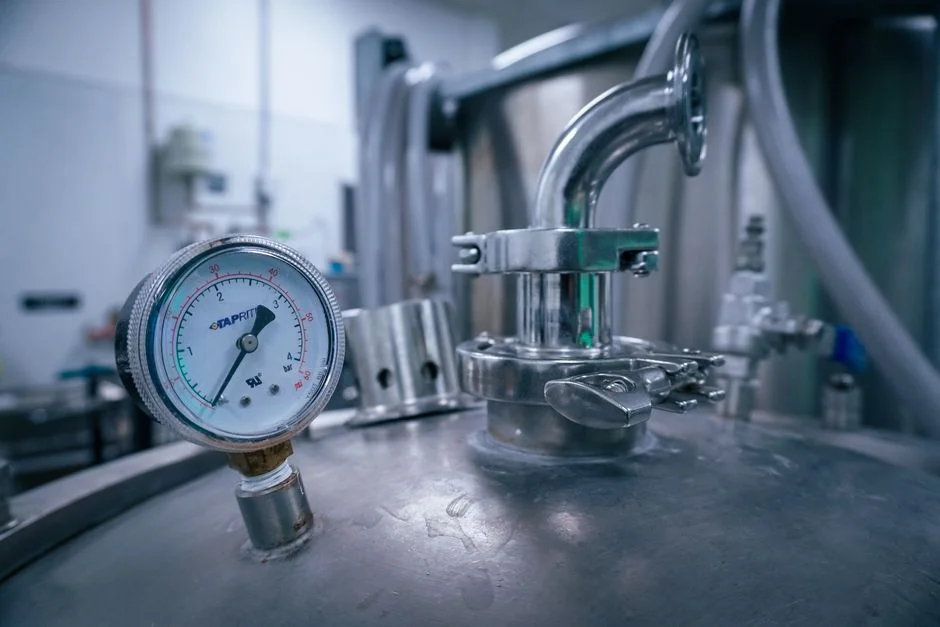
The 2026 retrofit sequence is the same across the four adhesive sub-streams: rotary bar screen → equalization basin → DAF pre-treatment for TSS, FOG, and broken-emulsion capture → MBR biological stage for bulk organics (60% smaller footprint than CAS with sub-1 µm filtration) → pH/H₂O₂ trim skid → AOP reactor → ClO₂ residual disinfection or UV sterilization → sewer discharge or RO polish for reuse (S3). The DAF sits ahead of the MBR because surfactant-stabilized emulsions break under air flotation, and the floated sludge dewaters more easily than membrane-fouled biomass (S3). The MBR is the bulk-removal workhorse; the AOP is the polish that closes the gap to NPDES or BAT-AEL. pH targets are family-specific: 7–9 for O₃/H₂O₂, 5–7 for EAOP depending on anode chemistry, and 2.8–3.2 for classic Fenton with downstream neutralization to pH 7 using lime or NaOH (S3). For a first-installation risk-controlled retrofit, run a parallel slip-stream: route 20–30% of MBR permeate through a pilot AOP skid for 4–8 weeks to validate the dose envelope on actual plant effluent before freezing the full-scale design — extrapolation of municipal ozone doses onto emulsion matrices is the single most common error on adhesive retrofits (S3). For reference, the same envelope logic is documented in our denim-washing ozone AOP case study, where polymer-dye matrices behave similarly to polymer-emulsion matrices.
CAPEX, OPEX, and Reuse Credit by Family
Order-of-magnitude CAPEX for a 50–200 m³/d adhesive AOP retrofit: O₃/H₂O₂ and UV/H₂O₂ skids sit in the lower CAPEX band; EAOP modular cabinets in the mid-band carry the lowest OPEX at PNEC polishing load (per Axine, 2026). The OPEX drivers are family-specific and worth surfacing in any board paper.
| Family | CAPEX band | Dominant OPEX driver | Reuse credit |
|---|---|---|---|
| O₃/H₂O₂ | Lower | Ozone generation 1–2 kWh/kg O₃ + H₂O₂ purchase | Partial — cooling-tower make-up possible |
| UV/H₂O₂ | Lower | Lamp/ballast replacement + mercury disposal + H₂O₂ | Partial |
| Fenton / photo-Fenton | Lower | Iron sludge handling + acid/neutralization reagents | Limited |
| EAOP (BDD/MMO) | Mid | Electrical energy per kg COD removed; no consumables | 30–60% freshwater offset as cooling-tower make-up; boiler feed via RO polish |
The reuse credit is the line that swings NPV. AOP polish to PNEC enables 30–60% freshwater offset when routed to cooling-tower make-up; for higher-purity reuse, industrial RO polishing after AOP brings conductivity and TOC down to boiler-feed spec (per HydropureWater vaccine AOP guide, 2026; S3). A second lever is the service model: a vendor that finances, owns, and operates the modular AOP under a guaranteed performance contract converts CAPEX to OPEX — attractive for an adhesive producer that does not want to own a new unit process (per Axine, 2026; S3). Frame the choice as a Scope 1 carbon move: on-site electricity-driven AOP is lower carbon than trucking and 800–1,200 °C incineration of solvent-contaminated waste, which matters for the 2026 ESG disclosure cycle. Track the AOP-specific line items alongside the AOP and MBR dashboard KPIs so the savings are visible month over month.
Compliance and Procurement Checklist
The procurement committee will ask three questions. First, the U.S. anchor: 40 CFR Part 414 (OCPSF — Organic Chemicals, Plastics and Synthetic Fibers) governs adhesive and sealant plant discharges; site-specific NPDES pretreatment limits set the floor for BOD, COD, TSS, and priority pollutants — confirm with the local POTW before any pilot (S3). Second, the EU anchor: Industrial Emissions Directive 2010/75/EU BAT-AELs apply to adhesive and coating installations above the capacity threshold; confirm applicable BAT conclusions with the local competent authority before design freeze (S3). Third, the Asia pivot: India CPCB has pushed zero liquid discharge for several adhesive clusters (Kanpur, Vatva) and China is tightening GB discharge limits on volatile organics through 2026 — direct discharge to surface water is no longer the default (S3). On the ESG line, PNEC-style thresholds (sub-ppb for problematic additives) are now part of the procurement scorecard for downstream brand-owner supplier audits, and reuse targets are increasingly embedded in supplier disclosures (S3). For the family-selection conversation, the companion AOP-family engineering guide walks the same matrix at one level deeper.
Frequently Asked Questions
What COD removal can ozone-based AOP realistically hit on water-based adhesive matrices?
O₃/H₂O₂ and UV/H₂O₂ typically reach 60–77% CODcr on real adhesive effluents, with a comparable polymer-dye textile case study at 80% COD; EAOP achieves up to 90%+ COD/TOC and full mineralization (per Axine, 2026; per WaterAndWastewater, 2026). Treat municipal ozone dose curves as non-transferable — run the jar test on your own MBR permeate before pilot.
Is O₃/H₂O₂ or EAOP the right choice for PSA solvent wash water?
PSA solvent wash water (toluene, ethyl acetate, heptane) is the case for O₃/H₂O₂ (peroxone) or EAOP. The 2026 design envelope is 0.5–2 kg O₃/h on 50–100 m³/h at H₂O₂:O₃ mass 0.3–0.5, pH 7–9 (per Axine, 2026). Select EAOP when sub-ppb discharge and 30–60% cooling-tower reuse credit are required, because it mineralizes VOCs to CO₂ without ozone off-gas or mercury-lamp waste.
Does the AOP have to sit downstream of the MBR, or can it replace the MBR?
The AOP should sit downstream of the MBR on adhesive matrices. The MBR is the bulk-removal workhorse and typically removes 60–85% of influent COD; the AOP is the polish that closes the gap to NPDES, BAT-AEL, or PNEC targets. Direct AOP on raw emulsion is uneconomical because surfactants scavenge •OH and inflate the dose envelope beyond reason (per Axine, 2026).
Which regulations govern discharge from an adhesive plant in 2026?
In the U.S., 40 CFR Part 414 (OCPSF) sets adhesive and sealant discharge categories, with site-specific NPDES pretreatment limits. In the EU, IED 2010/75/EU BAT-AELs apply above the capacity threshold. India CPCB has moved Kanpur and Vatva toward ZLD, and China is tightening GB VOC limits through 2026 — direct surface-water discharge is no longer the default in either jurisdiction (S3).
Related Equipment
- ozone generation skid — specifications, capacity range, and technical data
- PLC-controlled H2O2 and pH dosing skid — specifications, capacity range, and technical data
- ClO2 residual disinfection and UV sterilization stage — specifications, capacity range, and technical data