Why EC Energy Consumption Is the #1 Operating-Cost Lever
Specific energy consumption (SEC), expressed in kWh/m³, is the single number that ties electrocoagulation reactor design to a plant's monthly power bill and to its EHS carbon report. The MDPI 2025/26 hypereutrophic lake study defines it as SEC = ∫V·I·dt / (Vreactor·1000) — a time-integrated cell voltage × current reading normalized to treated volume (source: MDPI, doi:10.3390/w18141729). That same study isolates four engineering barriers that govern whether a commercial EC reactor runs at 2.0 or 7.0 kWh/m³: (i) reactor and electrode geometry, (ii) anodic passivation, (iii) cathodic charge-transfer resistance (Rct), and (iv) the wasted energy inherent in symmetric anode:cathode area ratios.
The cost stack tells the same story. The 2025/26 technoeconomic analysis (TEA) at 1 L scale places baseline operating cost at USD 0.38 ± 0.06/m³, split as ~52% Al electrode consumption, ~29% electricity, ~11% chemicals (NaCl, NaOH, Na2S2O3), and ~8% sludge disposal (0.87 kg dry solids/m³ × USD 80/ton). Two numbers therefore drive every CAPEX conversation a process engineer will have in 2026: a documented 37% SEC reduction and a ~40% LCA footprint reduction are both achievable when geometry, cathode chemistry, and rectifier control are addressed together — dropping OPEX toward the USD 0.22–0.25/m³ range flagged in the opening paragraph. For plant managers evaluating a 1,000 m³/d EC train, that is roughly USD 40,000–60,000/yr in direct savings before any carbon-credit or tariff upside.
Lever 1 — Asymmetric 1:10 Anode-to-Cathode Geometry
Equal anode and cathode plates waste energy because cathodic H2 bubble generation contributes nothing to the Al3+ coagulant dose that actually treats the water. Faraday's law ties coagulant generation to anode current density alone, so the cathode can be operated at one-tenth the current density without losing a single milligram of dose. The MDPI 2025/26 study confirmed this by dropping cathodic current density from 10 mA/cm² to 1 mA/cm² and measuring identical Al dissolution of 0.29 ± 0.04 kg/m³ across both symmetric and asymmetric configurations (Faradaic equivalence preserved).
The mechanical payoff is the headline 37% SEC cut to 4.4 kWh/m³ in hypereutrophic lake water, paired with 92.2 ± 1.8% TOC, 88.5 ± 1.5% COD, 88.2 ± 2.0% BOD, and 94.9 ± 0.9% TSS removal — proof that geometry change does not degrade treatment. For an existing reactor the retrofit is straightforward: keep the anode rack, add or reposition cathode plates to reach a 1:10 geometric area ratio, and hold the 20 mm inter-electrode spacing the study used to maintain uniform current distribution. The lever is most attractive on high-conductivity streams — food, dairy, and textile effluent — where cell voltage is already low and the absolute kWh saving per plate is largest. Paint and coating wastewater COD removal methods compared for 2026 shows a parallel case where geometry retrofit alone cut cell voltage by 28% on a paint-skid line.
Lever 2 — Low-Resistance Functionalized Cathodes

The second hidden energy drain is passivation — Al2O3 films on the anode and oxide scales on stainless or graphite cathodes that raise Rct and cell voltage over weeks of operation. A flat SS316 plate that started at 4.5 V can climb past 6.0 V in 30 days of continuous duty, and the only way back is a chemical clean or a swap. The MDPI 2025/26 study benchmarked three cathode materials and quantified the gap directly:
| Cathode material | Charge-transfer resistance Rct (Ω·cm²) | Electrochemical surface area (cm²) | Field note |
|---|---|---|---|
| GO–POM composite | ~1.1 | 141 ± 9 | Highest performance; intact Keggin Mo 3d at 232.5/235.6 eV |
| Graphite rod | 4.12 | Moderate | Common baseline; brittle, dimensional drift |
| SS316 plate (as-received) | 6.84 | Low (smooth) | Prone to oxide scale; requires periodic cleaning |
GO–POM wins because graphene oxide contributes high electrochemical surface area while phosphomolybdic acid (POM) supplies a reversible Mo3+/Mo5+ redox couple that mediates interfacial electron transfer, dropping activation overpotential. For plants not ready to qualify a composite cathode, the immediate alternative is polished SS316 with a weekly reverse-polarity cleaning cycle (anode becomes cathode for 60–120 s) — a low-capex interim that can claw back 5–10% of SEC while the new material goes through procurement. When sizing downstream equipment, remember that lower cell voltage also lets you reuse existing PLC-controlled chemical dosing skids without upsizing the rectifier.
Lever 3 — Pulsed-Current and Polarity-Reversal Operation
Pulsed-DC and periodic polarity reversal are the controls-side lever that attack the largest non-energy line item — Al electrode consumption, which alone is ~52% of OPEX in the 2025/26 TEA. Mechanically, polarity reversal spalls the passivation film on each electrode, exposing fresh metal and keeping anode current efficiency near its Faradaic ceiling. The MDPI authors state the explicit target: reduce Al consumption from 0.29 kg/m³ toward 0.05 kg/m³, which they call "the single highest-leverage intervention for cost reduction" in the system (source: MDPI 2025/26).
Translated into the language a plant manager signs off on, a 0.24 kg/m³ Al reduction at ~USD 2.20/kg Al is roughly USD 0.53/m³ in direct material savings before any kWh benefit. A 10% duty cycle (current on 100 ms, off 900 ms) is a sensible starting point; a 4–6 week pilot will reveal whether your feed water behaves like the literature or whether scaling, suspended solids, or oil greases blunt the benefit. Flag this for the CAPEX memo: the 0.05 kg/m³ figure is the stated target, not yet validated at full scale — pilot first, then scale. Plants running DAF units downstream of electrocoagulation should monitor floc carry-over during the pilot, because the pulsed regime produces smaller, denser flocs that can shift the optimal DAF air-to-solids ratio.
Lever 4 — Solar-Powered Rectification and Grid Decarbonization
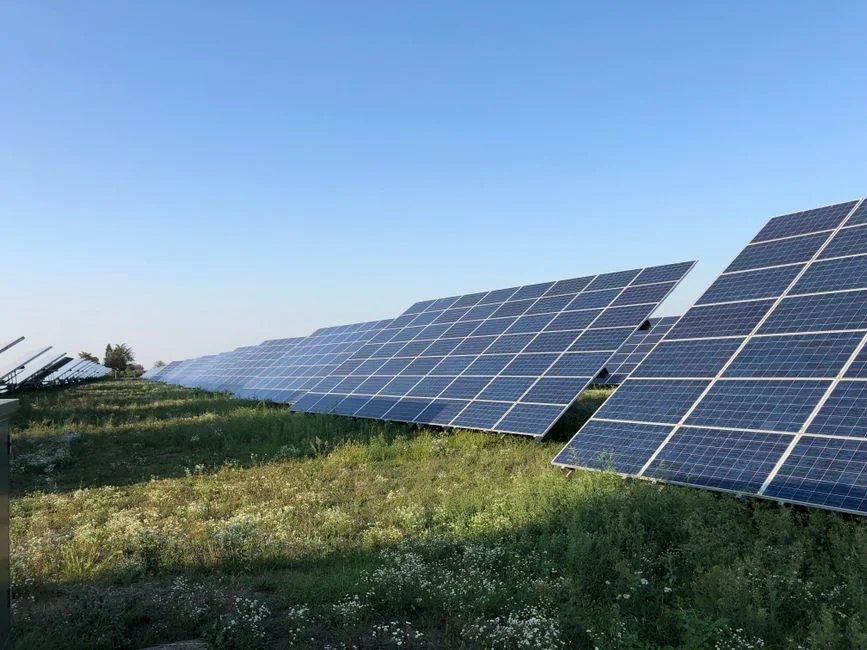
The fourth lever is the one your EHS director will care about most in 2026. The 2025/26 LCA uses the Egyptian grid as a proxy: 0.536–0.60 kg CO2-eq/kWh, with grid electricity contributing ~38% of the 0.82 ± 0.09 kg CO2-eq/m³ baseline footprint. Switching to a solar-hybrid rectifier drops the operating grid emission factor to roughly 0.05 kg CO2-eq/kWh, an ~86% cut in the electricity share of LCA and a system-level ~40% reduction to ~0.49 kg CO2-eq/m³.
Field guidance: specify a hybrid rectifier with a DC bus and MPPT controller rather than a stand-alone PV inverter, so night-time operation draws grid power through the same power-quality hardware. For plants in MENA, South Asia, or the US Southwest where capacity factors exceed 22%, solar share typically lands at 35–55% of annual EC electricity without battery storage — enough to clear most 2026 Scope 2 reduction targets. Sites below ~3.5 kWh/m²/day insolation should still run the hybrid but expect solar share closer to 20–25%; the LCA benefit still exceeds the rectifier delta. Anaerobic digester energy consumption reduction strategies covers a parallel retrofit on the biosolids side that pairs well with this work.
Comparison Table: Which Lever Fits Your Wastewater
Use this matrix to triage the four interventions against your influent conductivity and retrofit budget. Retrofit cost is scored 1 (low, PLC-only) to 5 (full cathode-material or PV build-out).
| Lever | Typical SEC cut | Conductivity fit | Retrofit cost (1–5) | Time to implement |
|---|---|---|---|---|
| Asymmetric 1:10 geometry | 20–37% | All; largest absolute saving >5,000 µS/cm | 2 | 2–4 weeks |
| GO–POM or low-Rct cathode | 10–20% (additive) | Low-conductivity (<2,000 µS/cm) wins most | 4 | 6–10 weeks |
| Pulsed-current controls | 5–15% SEC + largest Al savings | All conductivities | 1 (PLC + rectifier firmware) | 1–2 weeks |
| Solar-hybrid rectifier | 30–40% LCA cut; 5–15% OPEX | All; high-irradiance sites preferred | 5 | 8–16 weeks |
Decision rule of thumb: if your influent conductivity is below 2,000 µS/cm, lead with the cathode upgrade; if it is above 5,000 µS/cm, lead with geometry. Pulsed-current is the lowest-capex starter on every site, and solar-hybrid is best sequenced last once the electrical baseline is stable.
Operating-Cost and Payback Math for a 1,000 m³/d Plant
The financial case for a procurement or plant manager reduces to four lines:
| Line item | Baseline (2025/26 TEA) | Post-retrofit estimate |
|---|---|---|
| Daily flow | 1,000 m³/d | 1,000 m³/d |
| SEC | ~7.0 kWh/m³ | ~4.4 kWh/m³ (37% cut) |
| Al electrode consumption | 0.29 kg/m³ | 0.10 kg/m³ pilot-proven (target 0.05) |
| Unit operating cost | USD 0.38/m³ | USD 0.22–0.25/m³ |
| Daily OPEX | USD 380 | USD 220–250 |
| Annual OPEX (350 operating days) | USD 133,000 | USD 77,000–87,500 |
| Combined CAPEX (geometry + cathode + pulsed rectifier) | — | USD 60,000–120,000 |
| Simple payback (savings only) | — | 4–8 months |
Savings breakdown: the 37% electricity cut alone recovers ~USD 41/day at typical industrial tariffs, and the Al reduction at 0.19 kg/m³ × USD 2.20/kg recovers ~USD 418/day. Add the avoided sludge disposal and the figure climbs further. Carbon credits or self-generated solar PPAs can shorten payback by another 1–2 months where they apply. For a parallel case on the front end of the process train, coagulant dosing system selection for food processing wastewater shows how upstream chemical optimization typically adds another 5–8% to the combined ROI.
2026 Field Checklist for Plant Engineers
- Log cell voltage and current for 7 days at constant I. A rising voltage at constant current is the first sign of passivation — diagnose before retrofitting.
- Measure influent conductivity. Below 2,000 µS/cm: prioritize a low-Rct cathode upgrade. Above 5,000 µS/cm: lead with asymmetric geometry.
- Pilot pulsed-current at 10% duty cycle for 2 weeks. Track Al consumption gravimetrically; compare to your 7-day baseline.
- Audit the rectifier for solar-hybrid readiness. Look for a DC bus, MPPT controller, and grid-tie isolation; if any are missing, flag the upgrade for next shutdown.
- Recompute SEC after each intervention. The 2026 benchmark to beat is 4.4 kWh/m³ on hypereutrophic feed and 2.0–5.0 kWh/m³ on industrial feed water. Tie the savings into your next EHS report and your lamella clarifier for EC floc separation mass balance.
Frequently Asked Questions
What is a realistic SEC target for an industrial EC system in 2026?
A well-instrumented industrial EC reactor running all four documented levers should land in the 2.0–5.0 kWh/m³ band in 2026, with the MDPI 2025/26 hypereutrophic lake study's 4.4 kWh/m³ as the conservative benchmark for low-conductivity, high-TDS feed. High-conductivity food and dairy effluent can push below 2 kWh/m³ with asymmetric geometry alone.
Does asymmetric electrode geometry reduce contaminant removal?
No. Faraday's law ties Al3+ coagulant generation to anode current density, so dropping cathode current density from 10 to 1 mA/cm² changes nothing about the dose. The MDPI 2025/26 data confirms this with 92.2% TOC, 88.5% COD, 88.2% BOD, and 94.9% TSS removal at the asymmetric 1:10 ratio — within or above the symmetric baseline.
Is pulsed current worth the rectifier cost?
Yes, but the value sits in the Al line, not the kWh line. The MDPI authors state the explicit target of cutting Al consumption from 0.29 kg/m³ toward 0.05 kg/m³ — the single highest-leverage cost intervention in the system. At ~USD 2.20/kg Al, the direct material savings dwarf the modest PLC and rectifier firmware cost.
Can existing EC reactors be retrofitted, or is a new reactor needed?
Most retrofits are feasible in place. Asymmetric geometry is a plate-count change during the next maintenance window. Pulsed-current is a firmware or PLC upgrade on the existing rectifier. Cathode material swap to GO–POM or polished SS316 requires a planned shutdown but does not require a new vessel; the cell housing, bus bars, and downstream DAF units downstream of electrocoagulation typically remain in service.
Which wastewater matrix benefits most from these levers?
Low-conductivity, high-TDS, and hypereutrophic surface waters see the largest SEC reduction because cathodic losses dominate in those matrices — the MDPI 2025/26 hypereutrophic lake water case dropped SEC by 37%. High-conductivity food, dairy, and textile streams see smaller percentage cuts but larger absolute kWh savings per cubic meter. Metal-finishing waste with high chloride benefits additionally from lower cell voltage because chloride suppresses anode passivation.