Why Collinsville-Area Food and Beverage Plants Cannot Discharge Untreated
Food and beverage plants in the Collinsville, Illinois portion of the Metro-East region send their wastewater across the Mississippi to the Metropolitan St. Louis Sewer District (MSD), and MSD enforces local limits that sit on top of — and almost always below — the EPA federal pretreatment floor. The influent these plants generate is fundamentally incompatible with a sewer system designed for domestic sewage: BOD routinely runs 10–20× higher than a typical residential discharge, FOG loads are episodic, and pH swings violently between acidic product streams and alkaline CIP cycles. A brewery dumping 2,500 mg/L BOD, a cheese plant pushing 3,000 mg/L, or a meat processor discharging high-strength cook-water cannot expect a downstream POTW to absorb that without consequences — surcharges, permit escalation, and ultimately mandatory pretreatment installation or production shutdown.
The CIP peak-flow problem is the single most common reason a system sized on average flow fails in practice. Production hours may produce relatively modest flow, then sanitation cycles release a surge of caustic and acidic cleaning water that can double or triple the instantaneous hydraulic load. Any equalization basin, DAF unit, or biological reactor sized against the daily average will be overwhelmed at the worst moment — exactly when the operator needs the system performing. A defensible Collinsville design has to absorb the peak, not just ride the mean.
Four characteristic waste streams converge at the plant headworks and must be characterized before any equipment is selected: process water from cooking, cooling, and product transfer; CIP chemicals (typically sodium hydroxide and nitric or phosphoric acid); boiler blowdown and cooling-tower bleed; and floor washdown carrying suspended solids. Treating these as a single blended stream without segregation is a recurring design error, because each stream demands a different unit operation and a different chemical regime. If pretreatment fails, the cascade is predictable: sewer surcharges first, then increased self-monitoring, then a formal compliance schedule, and finally permit revocation or production stop.
The Pretreatment Limit Stack: Federal Categorical Standards Plus MSD Local Limits
The federal floor for any industrial discharge to a POTW is EPA 40 CFR Part 403, which establishes baseline prohibitions, categorical standards, and local-limit authority. Categorical standards apply on top of Part 403 when a plant's SIC code matches a specific subcategory — Part 432 covers meat and poultry products, Part 405 covers dairy products, Part 406 covers grain mills, and Part 409 covers sugar processing. A brewery, beverage bottler, or confectionery plant typically falls under a beverage or "miscellaneous food" subcategory that may apply less stringent numerical federal limits but still inherits the Part 403 prohibition on pass-through and interference. Confirming the precise subcategory against the plant's primary product and SIC code is the first step in any limits review.
MSD local limits are where the real constraint sits. The Metropolitan St. Louis Sewer District operates an EPA-approved Pretreatment Program with its own local limits designed to protect the Bissell Point and Lemay treatment plants, the receiving Mississippi River, and the entire interceptor network. These local limits are typically stricter than the federal floor and commonly include caps on BOD, TSS, FOG, oil and grease, pH (often a 5.0–10.0 envelope, though the exact range is set by MSD), ammonia, and in some cases heavy metals. Permit terms also specify sampling points, monitoring frequency, and reporting obligations. The exact numerical values must be confirmed directly with MSD's Industrial Wastewater Pretreatment Program before any equipment is sized, because local limits are site-specific and change as the POTW's own discharge permit evolves.
| Parameter | Typical EPA categorical floor | Typical MSD local limit (confirm with authority) | Engineering implication |
|---|---|---|---|
| BOD₅ | Varies by subcategory (often 200–400 mg/L daily max) | Stricter; commonly 250–350 mg/L daily max in the Metro-East envelope | Defines biological stage sizing |
| TSS | Varies by subcategory | Stricter; commonly 250–400 mg/L daily max | Defines DAF and clarifier sizing |
| FOG / Oil & Grease | ~100 mg/L in many food subcategories | Often 100–200 mg/L; FOG program caps may be lower | Defines DAF surface loading rate |
| pH | 6.0–9.0 standard range | Often 5.0–10.0 MSD envelope; confirm current value | Defines equalization and dosing capacity |
| Ammonia (as N) | Subcategory-dependent | Seasonal limits possible; confirm | Defines nitrification stage if required |
The penalty ladder under both federal and local authority escalates predictably. A first excursion triggers a notice of violation and a monitoring increase. Repeated excursions trigger a compliance schedule with mandatory capital improvements. Continued failure triggers permit revocation and the credible threat of a production shutdown — which, in a food and beverage plant, is an existential event. The practical lesson is that the equipment-selection decision has to anchor against the strictest number in the stack, not the loosest. A comparable regional breakdown of the same limit-stack logic for a different MSD service area appears in this parallel Collinsville guide.
Matching Wastewater Characteristics to the Right Unit Operations
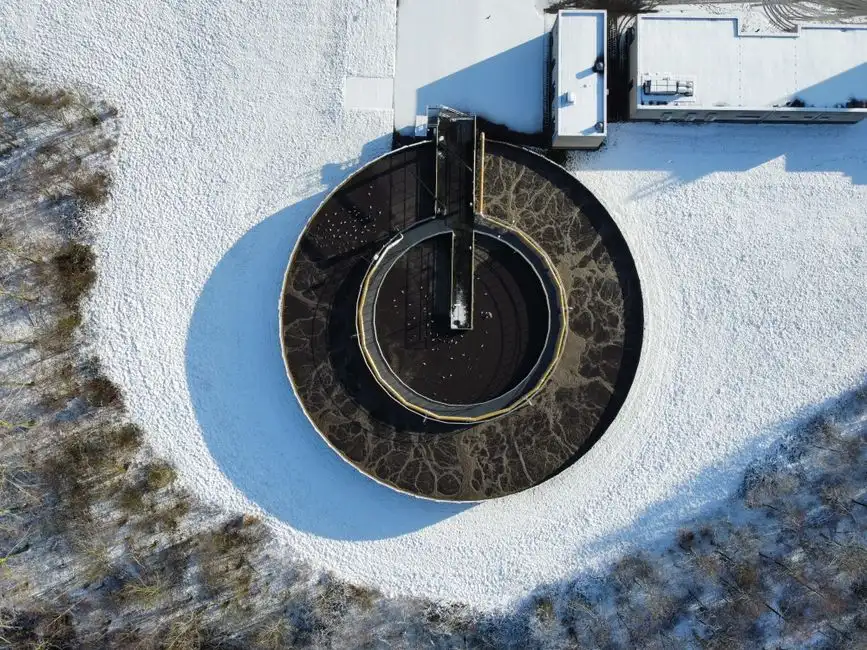
Once the limits are in hand, the engineering work is to map each contaminant to the unit operation that removes it, in the correct sequence. Four physical-chemical challenges define almost every Metro-East F&B wastewater: FOG, high BOD/COD, pH swings, and suspended solids. The train must address them in an order that protects the most sensitive downstream step — which is always the biological reactor.
FOG and floatable solids are removed first by dissolved air flotation, because free oil and grease coat biomass, clog aeration diffusers, and destroy settleability in a clarifier. DAF also pulls out a meaningful fraction of the suspended solids and colloidal BOD, which reduces the loading on the biological stage. pH swings — acidic fruit or dairy streams, alkaline CIP caustic — are neutralized through an equalization basin sized for at least one full CIP surge, or through active in-line dosing with a PLC-controlled chemical dosing skid. Biological treatment fails outside roughly pH 6.5–8.5, so pH must be inside that window before the mixed liquor leaves the EQ tank.
High BOD and COD are reduced by biological treatment. The four realistic options are conventional activated sludge, MBBR or IFAS, sequencing batch reactor (SBR), and MBR. Conventional activated sludge is the lowest-cost option for steady, high-flow plants; MBBR/IFAS handles shock loads better at the cost of higher aeration energy; SBR offers flexibility in a small footprint; MBR combines biological treatment with submerged membranes and produces the cleanest effluent. Residual TSS — including biomass solids — is then polished by a clarifier in conventional trains, or captured directly by the membrane in an MBR configuration. A final pH adjustment and, where the receiving authority requires, disinfection completes the train before flow enters the MSD interceptor. Coagulant and flocculant selection, which materially affects DAF performance, is covered in this food-grade coagulant dosing guide.
Three Realistic Pretreatment Trains Compared Head-to-Head
Three treatment trains cover essentially every realistic Collinsville F&B scenario. Each is defensible against the same influent envelope and the same MSD local limit stack, but they differ sharply in effluent quality, footprint, and CAPEX band.
Train 1 — DAF only. Appropriate only for the lightest waste streams and for plants whose local limit is set at the federal floor. DAF alone achieves 80–95% FOG/TSS removal (ALAR field data) but does very little for dissolved BOD, so it is rarely sufficient for a Metro-East F&B plant on its own. It is, however, the correct first stage in every realistic train because it protects everything downstream.
Train 2 — DAF plus conventional activated sludge (or SBR / MBBR). The historic workhorse. Produces effluent in the BOD 20–30 mg/L, TSS 20–30 mg/L range under steady operation, which clears most local limits with margin. The weakness is sensitivity to shock loads: a CIP surge can wash out the clarifier, kill settleability, and push TSS over the permit. Plants with variable production schedules need extra equalization or a more forgiving biological configuration to make Train 2 reliable.
Train 3 — DAF plus MBR. The integrated biological-and-membrane step delivers near-reuse-quality effluent, with the membrane providing a sub-1 μm barrier that captures biomass solids directly and eliminates the clarifier. MBR tolerates shock loads far better, shrinks the biological footprint by roughly 60% versus conventional activated sludge, and produces the most consistent effluent against tight local limits. The trade-off is higher CAPEX, membrane replacement every 7–10 years, and more sophisticated control. The footprint and effluent advantage of MBR over a conventional clarifier is detailed in this DAF vs clarifier decision guide for F&B plants.
| Train | Typical effluent BOD₅ | Typical effluent TSS | FOG in effluent | Footprint | Sensitivity to CIP surges | CAPEX band | Best fit |
|---|---|---|---|---|---|---|---|
| DAF only | 500–1,500 mg/L (largely unchanged) | 50–150 mg/L | 20–50 mg/L | Small | Low | Lowest | Lightest streams; pre-stage only |
| DAF + activated sludge (or SBR / MBBR) | 20–30 mg/L | 20–30 mg/L | <15 mg/L post-DAF | Reference (100%) | Moderate to high | Mid | Steady flow, federal-floor limits |
| DAF + integrated MBR system | <5 mg/L | <5 mg/L | <5 mg/L | ~40% of Train 2 | Low | High | Tight local limits, variable flow, reuse potential |
The decision rule is straightforward: if the local limits are at or near the federal floor and the production schedule is steady, Train 2 wins on total cost of ownership. If the local limits are tight, the production schedule is variable, or the site has footprint constraints, Train 3's compliance margin and smaller biological footprint pay back the additional CAPEX in reduced risk and avoided surcharges.
Sizing the System and Validating It Before You Buy
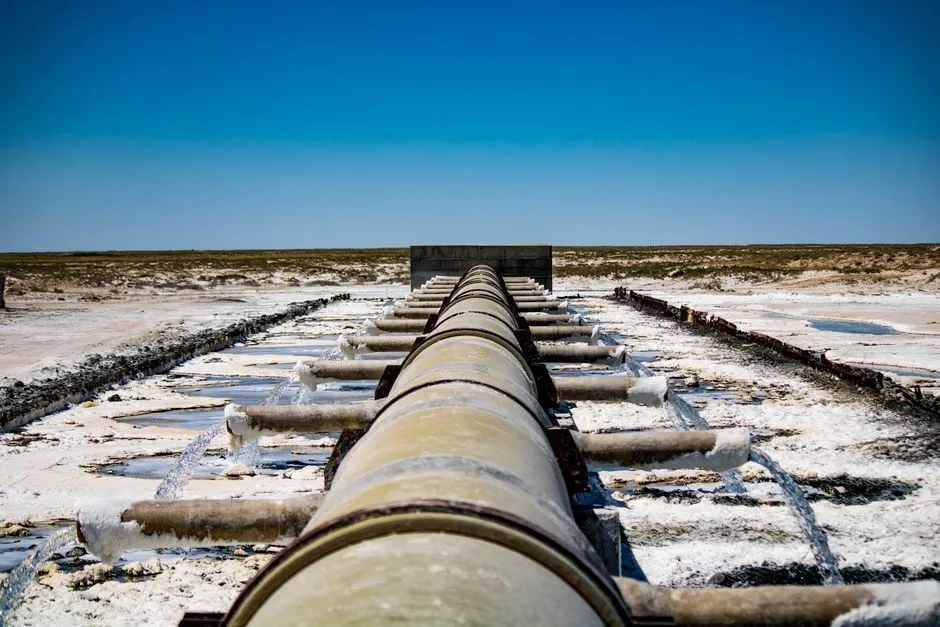
Translating the train into a defensible equipment specification requires real numbers from the plant, not textbook assumptions. The minimum design inputs are: average and peak daily flow, the peak-to-average ratio driven by the CIP cycle, influent BOD/COD/TSS/FOG/pH/temperature, the target effluent limits, and the site envelope (footprint, available head, discharge point to the MSD interceptor). Without these, any equipment selection is a guess dressed up as engineering.
The first validation step is a jar test. A standard six-beaker jar tester on a real sample of plant wastewater confirms coagulant and flocculant dose, the pH adjustment range required for stable floc, and the expected DAF underflow solids concentration. Jar testing takes a day, costs very little, and is the single most reliable way to anchor the chemical specification before DAF skids are ordered. The second validation step is an on-site pilot, typically a trailer-scale biological reactor and DAF run on real wastewater for two to four weeks. The pilot confirms biological treatability, MBR flux if MBR is in the train, and effluent quality under real production cycles — including the CIP surge that the average daily flow number hides. The pilot report also becomes part of the permit application and discharge documentation that MSD will request, so it pays for itself twice: once in design confidence, once in regulatory standing. A pre-pilot screen on the inlet side, using a rotary mechanical bar screen, protects both the pilot and the eventual full-scale system from rag and debris that would otherwise accumulate in the DAF or biological stage.
Operating Economics: What the Equipment Actually Costs to Run
CAPEX is dominated by flow capacity, the level of treatment (DAF-only versus full biological versus MBR), materials of construction (stainless for F&B hygiene and CIP chemistry), and the level of automation. A skid-mounted, PLC-controlled DAF plus an SBR for a small brewery will run an order of magnitude lower in CAPEX than a fully automated DAF plus MBR with chemical dosing, equalization, and sludge dewatering for a meat processor — but the operating profiles differ just as sharply.
OPEX is driven by chemical consumption (coagulant, flocculant, pH adjusters), aeration energy, pump energy, membrane replacement (for MBR, typically every 7–10 years at 15–25% of membrane CAPEX annualized), sludge hauling, and operator labor. Sludge dewatering — a plate-and-frame filter press or rotary vacuum drum — cuts hauled volume by 70–85% and is usually the single most impactful OPEX lever, because hauling liquid sludge is the most expensive line in any F&B wastewater budget. On-site pretreatment is almost always cheaper than hauling untreated waste off-site once flow exceeds roughly 20,000–30,000 gallons per day, and it converts a variable disposal expense into a fixed, predictable monthly cost. That predictability — not just the savings — is what makes the capital case to management.
Frequently Asked Questions
What BOD level does a Metro-East food and beverage plant typically send to the sewer?
Untreated F&B wastewater in the Metro-East region typically runs 10–20× higher than domestic sewage, with BOD₅ commonly in the 2,000–5,000 mg/L range for dairies, breweries, and meat processors. On-site pretreatment is required to bring that into the MSD local limit envelope, which is generally stricter than the EPA categorical floor for the applicable subcategory under 40 CFR Part 405 (dairy), 40 CFR Part 432 (meat and poultry), and similar standards.
Why is DAF usually the first unit operation in an F&B pretreatment train?
Dissolved air flotation removes 80–95% of FOG and a large fraction of suspended solids (ALAR field data) before the water reaches the biological stage. Without that step, free oil coats biomass, clogs aeration diffusers, and destroys clarifier settleability, which is why DAF-only trains are inadequate for dissolved BOD but DAF-plus-biology is the standard configuration for Metro-East F&B plants.
When does an MBR pay back its higher capital cost over a conventional activated sludge system?
An MBR pays back when the local limit is tight, the production schedule is variable with significant CIP surges, or the site footprint is constrained. MBR typically shrinks the biological footprint by roughly 60% versus conventional activated sludge, tolerates shock loads far better, and produces sub-5 mg/L BOD and TSS — compliance margin that avoids surcharges and permit escalation, which is where the real economic risk lives.
What is the penalty for non-compliance with MSD local limits?
Non-compliance escalates through a predictable ladder: notice of violation, increased self-monitoring, a formal compliance schedule with mandatory capital improvements, and ultimately permit revocation or production shutdown. Local sewer districts including MSD also levy sewer surcharges on discharges that exceed BOD, TSS, or FOG caps, so repeated excursions hit the operating budget long before they hit the permit.