
Why Textile Effluent Is a Different Beast
Textile finishing wastewater swings from 50 to 2,600 L of process water per kilogram of fabric — a 52× spread that depends on fiber, dye class, and machine vintage (Madhav et al. 2018; Bento et al. 2020, as reviewed in the PMC textile review). Apply that envelope to a 100 t/day finishing line and the daily hydraulic load runs 5,000 m³ for a tight knit-goods house up to 260,000 m³ for a denim wash range. Each wet stage layers a different contaminant class on that flow: desizing sheds starches and sizes (BOD-dominant); scouring drives pH above 12 with surfactants, fats, and oils; mercerizing adds caustic carryover; bleaching introduces residual peroxide, peracetic acid, or hypochlorite; dyeing drops 20–30% of the color dose as unfixed dye plus heavy-metal mordants (Cr, Cu, Zn, Mn); printing pushes urea, thickeners, and additional metals; finishing adds softeners, crosslinkers, and fluorocarbon repellents (Madhav et al. 2018; Periyasamy and Militky 2017).
The national-scale picture is just as uneven. In 2015, the Chinese textile sector discharged 1.84 billion tons of wastewater and 206,000 t of COD, ranking third and fourth respectively among 41 surveyed industries for five consecutive years (Ministry of Environmental Protection of China 2015, as reported in the PeerJ decoupling study). Overall water reuse in Chinese textiles sits below 70%, well under the 80% national industrial average, and reuse in printing and dyeing specifically is only 30% (China National Textile and Apparel Council 2018). Because dye fixation has never exceeded 85% (Periyasamy and Militky 2017), 15–30% of every dye dose is permanently on the waste side of the mass balance — and that is the load a 2026 plant must design around.
Mapping Contaminants to the Right Unit Operation
Designing textile wastewater treatment for reuse starts with a parameter table by stage, then matches each row to a unit operation that removes it cheaply. Real denimsite data show BOD as low as 9.8 mg/L with a biodegradability index (BOD/COD) of 0.009, color up to 3,000 Pt–Co units, pH swings from 2 to 12 across batch discharges, and chromium, copper, zinc, and manganese frequently left unquantified (Metcalf & Eddy 2014; Periyasamy and Militky 2017; Yogalakshmi et al. 2020, all in the PMC textile review). The table below is the working baseline a process engineer should pin to the wall before sizing any tank.
| Process stage | Typical pH | BOD (mg/L) | COD (mg/L) | TSS / lint | Color (Pt–Co) | Signature contaminants | Treatment target |
|---|---|---|---|---|---|---|---|
| Desizing | 6–9 | Up to 2,000 | Up to 5,000 | Starch, fiber lint | Low | Starch, PVA, carboxymethyl cellulose | Equalization + biological BOD removal |
| Scouring | 10–13 | 800–2,000 | 3,000–8,000 | Emulsified oils | Low–moderate | Surfactants, fats, NaOH | DAF for oils/surfactants; pH correction |
| Mercerizing | 13–14 | 200–500 | 1,500–3,000 | Low | Low | Caustic carryover | Neutralization + reuse as scour caustic |
| Bleaching | 8–11 | 200–600 | 800–2,500 | Low | Low | H2O2, peracetic acid, residual Cl | Catalyst destruction + equalization |
| Dyeing | 4–11 | 200–1,200 | 1,500–5,000 | Colloidal dye | Up to 3,000 | Azo/reactive dyes, Cr, Cu, Zn, Mn | DAF + biological + MBR + RO |
| Printing | 6–9 | 300–800 | 2,000–6,000 | Thickener residue | High (localized) | Urea, pigments, metals | DAF + biological + polishing |
| Finishing | 5–8 | 50–200 | 300–1,000 | Low | Low | Softener, DWR resins, fluorocarbons | Biological (slow) + carbon/RO |
Screening and grit removal protect downstream pumps from fibers, rags, and lint typical of woven lines. Equalization tanks must absorb the pH 2–12 swings of batch dyeing houses — a 24-hour buffer at 6–8 h HRT is the minimum. A Dissolved Air Flotation (DAF) system sized at 4–300 m³/h across 13 catalog models targets the colloidal dye, surfactant, and oil load, with a lamella option for 20–40 m/h high-rate duty. Biological treatment (CAS, SBR, or MBR) handles the soluble BOD/COD and partial decolorization — real-wastewater biological color removal peaks at 78.4% (Shoukat, Khan and Jamal 2019, in the PMC textile review). An MBR membrane bioreactor system running flat-sheet modules at <1 μm filtration and a 60% smaller footprint than CAS polishes that biological effluent and unlocks reuse.
The 2026 Treatment Train: Step by Step
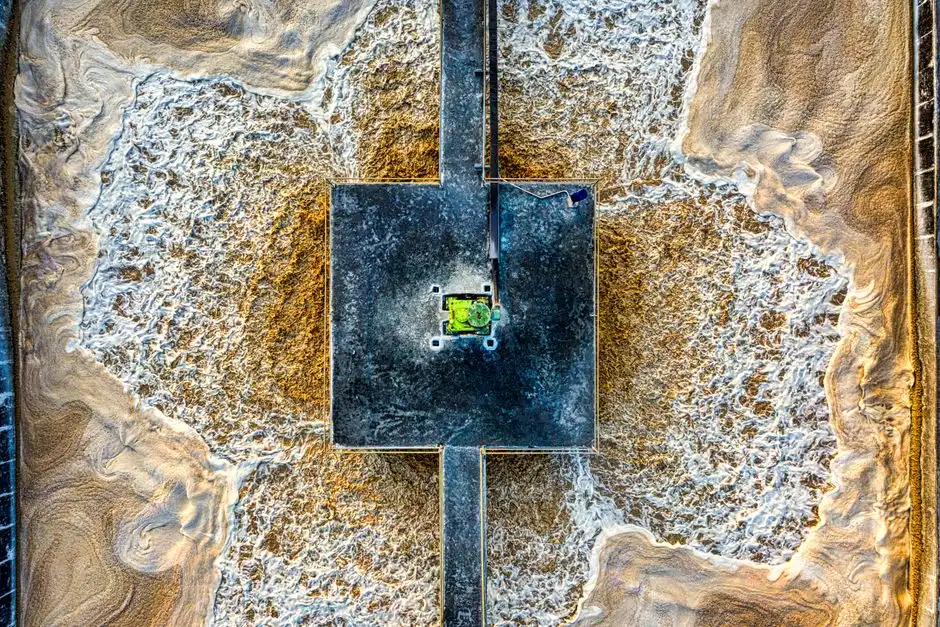
The 2026 defensible sequence is screening → equalization → DAF → biological → MBR → RO, with sludge handled by a filter press. Each step has a named unit and a numeric removal target.
- Step 1 — Screening. A rotary mechanical bar screen with 3–6 mm bar spacing protects downstream pumps and DAF nozzles from fibers, rags, and lint. Target: <50 mg/L TSS carryover from solids.
- Step 2 — Equalization + chemical conditioning. A 24-hour equalization basin with pH correction and an automatic chemical dosing skid for coagulant (FeCl3 or PAC 100–300 mg/L) and polymer (0.5–2 mg/L). Target: pH 6.5–8.0, ±0.5 swing across the day.
- Step 3 — DAF for color, TSS, oil and grease. Hydraulic residence 20–40 min, air-to-solids ratio 0.005–0.060, surface loading 20–40 m/h with lamella plates. Target: 60–90% TSS removal, 50–70% colloidal color removal, >90% oil and grease.
- Step 4 — Biological + MBR. Anaerobic stage for color and biopolymer breakdown (HRT 12–24 h) feeds an aerobic stage (HRT 18–36 h, MLSS 3,000–5,000 mg/L) followed by DF-series flat-sheet MBR modules at 0.1 μm pore. Target: BOD <5 mg/L, COD <50 mg/L, total color <50 Pt–Co, SS undetectable.
- Step 5 — RO polishing for reuse. An industrial reverse osmosis system with brackish-water elements at 75–85% recovery, multistage design. Target: conductivity <50 µS/cm, color 0 Pt–Co, suitable for process rinsing, dye-bath make-up, and boiler pre-feed.
- Step 6 — Sludge handling. A plate-and-frame filter press on the DAF float and waste-activated sludge delivers cake solids >25% DS, suitable for dye-laden biological sludge and downstream incineration or landfill.
Across the train, biological color removal holds at 78.4% on real wastewater (Shoukat, Khan and Jamal 2019), and nanofiltration or RO pushes the residual color to 100% removal (Balcik-Canbolat et al. 2017; Yu et al. 2018, in the PMC textile review). That 78.4% figure is the floor an aerobic stage must hit; anything below it justifies an AOP polishing step.
DAF vs Primary Clarifier, MBR vs CAS: Choosing the Right Core
Two equipment decisions drive both capex and compliance for a textile plant: the primary solids-removal step (DAF or clarifier) and the biological step (MBR or CAS). The decision framework below applies when the upstream load is the textile envelope above: pH 2–12 swings, 50–3,000 Pt–Co color, 9.8–2,000 mg/L BOD, and Cr/Cu/Zn/Mn spikes from dye baths.
| Decision axis | DAF | Primary clarifier (high-rate lamella) | MBR | CAS |
|---|---|---|---|---|
| Best feed | Oils, surfactants, colloidal dye, floatable lint | Gravity-settling TSS, low-oil streams | Reuse-grade polishing, variable loads, tight footprint | Large flows, available land, BOD-only targets |
| Surface loading | 5–20 m/h standard, 20–40 m/h lamella | 20–40 m/h lamella option | Flux 15–25 LMH at 0.1 μm | n/a (suspended growth) |
| Oil and grease capture | >90% | 10–30% | n/a | n/a |
| Color removal (real wastewater) | 50–70% colloidal | 10–20% | Basis 78.4% (biological) + membrane polish | Up to 78.4% biological only |
| Effluent TSS | 20–40 mg/L | 40–80 mg/L | <1 mg/L | 20–40 mg/L |
| Footprint vs CAS | Similar (clarifier-sized) | 1× baseline | 0.4× of CAS | 1× baseline |
| Reuse readiness | RO pre-treatment ready | Needs polishing | Direct RO feed after UF | Needs tertiary UF + RO |
| Pick when… | Surfactant, oil, or reactive-dye load dominates; tight layout | Stream is low-oil and gravity-settleable; capex-driven | Reuse target >70%, color <50 Pt–Co, footprint constrained | Flow >50,000 m³/day, land available, BOD-only discharge |
For 2026 reuse bids the MBR/RO pairing is the workhorse: MBR delivers <1 μm filtration, 60% smaller footprint than CAS, and effluent directly suitable as RO feed, while RO closes the loop on color and salts. When the biological color removal sits below the 78.4% benchmark (Shoukat, Khan and Jamal 2019) — common with sulfur and reactive dyes — the residual gap is closed by an AOP stage. Photo-Fenton has cleared >98% color in real wastewater (Lebron et al. 2021, in the PMC textile review), and photocatalytic systems hit 95–97% (synthetic and real). None of the 172 studies reviewed in the PMC paper demonstrated industrial-scale AOP results, however; that technology remains TRL 5–7 in 2026 and should be piloted, not procured as turnkey.
Reuse Tiers, Discharge Limits and the 2026 Compliance Map
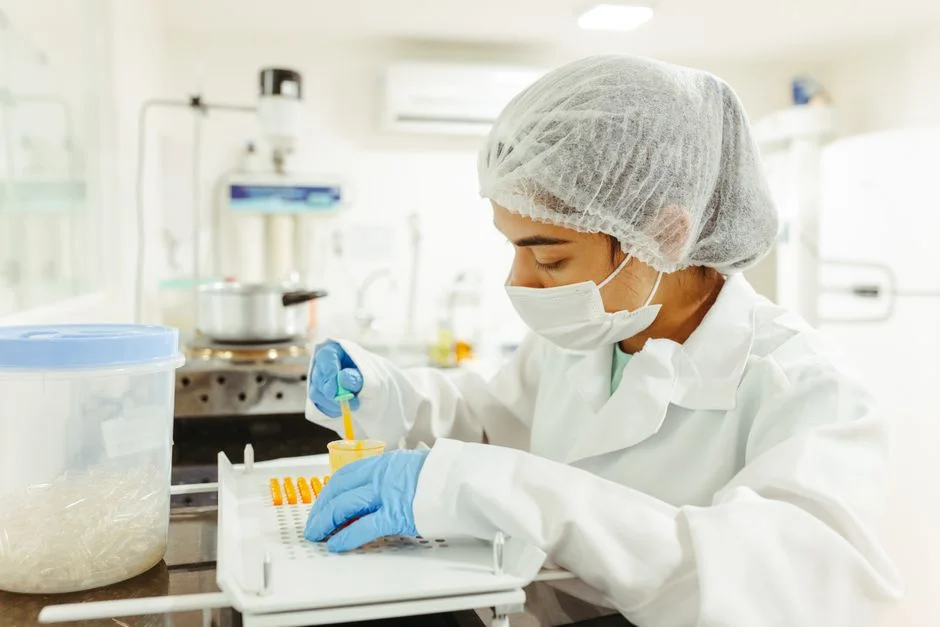
Reuse is not a single target but three nested tiers, each with a process-water fit. RO permeate (conductivity <50 µS/cm, 0 Pt–Co color) is the only stream suitable for dye-bath make-up and high-stakes rinsing. MBR or UF permeate (TSS <1 mg/L, color <50 Pt–Co) fits washing, cooling-tower make-up, and boiler pre-treatment after softener polish. Biological effluent (BOD <20 mg/L, color <200 Pt–Co) is acceptable for yard wash, irrigation, and screen-print wash-down where regulations allow. The MBR/RO link is the reuse enabler; without the <1 μm MBR barrier, RO membranes foul in weeks on a textile feed.
Discharge limits stack across jurisdictions. The US EPA textile effluent guidelines (40 CFR 410) cap BOD, TSS, and metals by subcategory; the EU Urban Waste Water Treatment Directive 91/271/EEC sets COD 125 mg/L, BOD 25 mg/L for industrial discharges to municipal sewers; and the Taiwan EPA standards cited in the PMC textile review set specific limits on color (Pt–Co), chromium, and residual chlorine for textile discharges. Compliance on metals — Cr, Cu, Zn, Mn — is the most common audit finding: the PMC review notes that "the studies shown in Table 1 do not determine most of the related parameters (N.D.); this demonstrates an inconsistency and a breach of the international guidelines." A 2026 sampling plan must add those four metals to every monthly composite.
The economic weight justifies the spend. The textile sector supports 35 million jobs, contributes 7% of global exports, and the global textile and apparel market was valued at $1.9 trillion in 2019, projected to reach $3.3 trillion by 2030 (Desore and Narula 2018; Hajjar 2020, in the PMC textile review). For ESG reporting and CDP submissions, the reuse-rate uplift translates directly into Scope 3 water withdrawal reductions that auditors quantify. A UV sterilizer for water treatment upstream of any reuse loop closes the bacterial regrowth risk on RO permeate storage.
Reuse Economics: Moving from 30% to 90% Water Recycle
Print-and-dye reuse at 30% (China National Textile and Apparel Council 2018) means a 50,000 m³/day mill discharges 35,000 m³/day to drain — most of which is recoverable. Apply the train above: DAF trims TSS and oil, MBR drops BOD/COD and color to reuse-RO-feed levels, and RO at 80% recovery of the MBR permeate stream unlocks 30,000+ m³/day of reusable water per day. HydropureWater's industrial RO system delivers up to 95% recovery, so the headroom is real, not theoretical.
Payback math is sensitive to three numbers: fresh-water tariff, effluent discharge charge, and dye savings from recovered process water (less dye lost in softened, low-TDS make-up). At a $1.50/m³ fresh-water cost and a $1.00/m³ discharge tariff, a 30,000 m³/day reuse stream saves $75,000/day on water plus $30,000/day on discharge — $38.3 million per year before dye savings. Add recovered process heat and the MBR/RO capex clears its hurdle in 18–30 months for most Asian and EU mills; in US sites with higher tariffs the payback is closer to 12 months. These figures align with the textile industry development plan target of 23% reduction in water intake per unit of industrial added value by 2020 (PeerJ decoupling study) and the renewed 2026 ESG push for absolute water decoupling. The full build sheet — including stage-by-stage recovery targets and membrane-cleaning frequency — sits in the RO process guide for textile wastewater.
Frequently Asked Questions
What is the typical water footprint per kilogram of fabric in textile finishing?
Textile finishing uses 50 to 2,600 L of water per kilogram of fabric depending on fiber, dye class, and machine vintage (Madhav et al. 2018; Bento et al. 2020). A 100 t/day line therefore generates 5,000 to 260,000 m³/day, which is the envelope any 2026 treatment train must be sized against.
What reuse rate can a 2026 textile wastewater plant realistically hit?
The 2026 industry baseline sits below 70% overall and 30% in printing and dyeing, but a sequenced MBR + RO train at 75–85% RO recovery routinely pushes total reuse past 90% (China National Textile and Apparel Council 2018; HydropureWater field data, 2026).
Why is an MBR preferred over CAS for a textile reuse plant?
MBR delivers <1 μm filtration in a footprint 60% smaller than CAS, holds effluent TSS below 1 mg/L, and produces RO-grade feed without a tertiary UF step — a key reason it has become the 2026 workhorse for textile reuse bids (HydropureWater catalog; PMC textile review).
What biological color-removal efficiency should an aerobic stage be designed for?
78.4% color removal on real textile wastewater is the published benchmark (Shoukat, Khan and Jamal 2019, in the PMC textile review). Anything below that figure on a steady-state basis means an AOP polish is required to hit <50 Pt–Co reuse targets.
Which metals are most often missed in textile effluent monitoring?
Chromium, copper, zinc, and manganese are the four dye-fixation metals most often left unquantified, even though they are flagged in international guidelines (Periyasamy and Militky 2017; PMC textile review). A 2026 sampling plan should add all four to every monthly composite.