Why Textile Mills Need Containerized Wastewater Treatment
The US EPA benchmark for textile dyeing is 40 L of freshwater per kg of cloth processed, which scales to roughly 800 m³/day for a 20 ton/day dye house and 1,000–2,500 m³/day for a mid-size mill running multiple lines. China's textile sector discharged 1.84 billion tons of wastewater in 2015, ranking third among 41 key industries and fourth in chemical oxygen demand load (PeerJ 2020, China National Textile and Apparel Council 2018 data). The global water footprint sits in the same order of magnitude, and a reuse rate of only ~30% in printing and dyeing — versus ~80% in the broader industrial sector — leaves the gap that containerized treatment is positioned to close.
Textile effluent comes from eight process steps: sizing, de-sizing, scouring, bleaching, mercerizing, dyeing, printing, and finishing. Bleaching, dyeing, and finishing together consume more than half of total process water (Springer 2025). When a mill adds a new line, expands capacity, or commits to a ZLD upgrade, civil construction rarely fits the schedule: equalization basins and reinforced tanks can take 12–18 months. A containerized wastewater treatment plant for the textile industry is the alternative — skid-mounted or ISO-container-mounted modules, pre-piped, pre-wired, PLC-controlled, lifted onto a concrete pad in days, and commissioned in 8–14 weeks from PO.
What Goes Into Textile Effluent: Influent Characteristics Engineers Must Design For
Textile influent is one of the most variable streams an industrial ETP will see, and the design envelope below is what every containerized MBR + DAF train must be sized against. COD typically lands at 800–3,000 mg/L, BOD₅ at 200–800 mg/L (BOD/COD ratio 0.2–0.4, meaning poorly biodegradable), TSS 200–1,000 mg/L, color strong and often persistent, pH swinging 6–12, and temperature 30–60 °C from hot dye baths. Conductivity runs 2,000–8,000 µS/cm because reactive and vat dyeing carry heavy salt dosing.
Heavy metals are documented across nearly every review: Zn, Cd, Ni, Pb, Co, Cr, Fe, Mg, Cu, P, Na, K (Springer 2025). Chromium and copper are the species that drive precipitation/coagulation selection upstream of the MBR — both form hydroxides in the 8–9 pH band, which is exactly where DAF performs best. Reactive dyes hydrolyze in water and resist biological oxidation, disperse dyes are hydrophobic and tend to float (a DAF problem), vat dyes are largely insoluble and report to sludge, and azo dyes cleave under anaerobic conditions into amines that MBR can partly mineralize. The implication is that no single biological step is enough; MBR is the workhorse, but reuse or tight discharge usually demands a downstream UF/RO polish.
| Parameter | Typical textile influent range | Design implication |
|---|---|---|
| COD | 800–3,000 mg/L | Drives MBR HRT and SRT; target effluent <100 mg/L |
| BOD₅ / COD | 0.2–0.4 | Poorly biodegradable; biology alone insufficient for reuse |
| TSS | 200–1,000 mg/L | DAF must remove 90%+ upstream of membranes |
| pH | 6–12 (batch swings) | Equalization HRT 8–12 h, neutralization dosing |
| Temperature | 30–60 °C | Cooling to <38 °C before MBR to protect biomass |
| Color | Strong, dye-class dependent | DAF 60–80% removal; polish via RO or AOP |
| Heavy metals (Cr, Cu, Zn, Ni, Pb) | 1–50 mg/L total | pH 8–9 coagulation in DAF feed |
| Conductivity / TDS | 2,000–8,000 µS/cm | RO required to reach reuse spec <50 µS/cm |
Water reuse in textile printing and dyeing is only ~30% (PeerJ 2020, citing China National Textile and Apparel Council 2018), versus the ~80% industrial average. The 50-point gap is the engineering opportunity for a containerized reuse train: every additional percent of recovery at a 1,000 m³/day mill is roughly 365,000 m³/year of avoided freshwater intake and 365,000 m³/year of avoided discharge.
The Containerized Treatment Train: Equalization → DAF → MBR → UF/RO
A reference containerized train for a textile mill is a sequence of pre-assembled modules, each sized to a 20-ft or 40-ft ISO footprint, plumbed together on a single concrete pad. The logic is flow-paced: each step removes what the next step cannot tolerate.
Step 1 — Equalization. One 20-ft or 40-ft container with a stainless or coated carbon-steel basin, mechanical mixer, pH probe, and conductivity probe. Typical HRT 8–12 h buffers the batch swings from jet dyeing machines (pH 6–12, temperature 30–60 °C) so downstream biology sees a steady feed. Without EQ, no biological or membrane stage can hold a setpoint on textile duty.
Step 2 — Coagulation/Flocculation + DAF. A DAF system with polyaluminum chloride or ferric chloride dosing, polymer flocculation, and a saturator loop at 5–7 bar. Hydraulic retention 20–30 min, surface loading 10–20 m³/m²·h, TSS removal 90–95%, color removal 60–80%. DAF carries the heavy-metal co-precipitation load (Cr, Cu, Zn) at pH 8–9, so the MBR sees a feed that is biologically friendly and spectrally quieter.
Step 3 — MBR. One or more 40-ft containers housing a submerged PVDF flat-sheet or hollow-fiber module (0.1 µm nominal pore), coarse-bubble aeration, permeate suction pump, CIP skid, and PLC. A HydropureWater containerized MBR system typically runs HRT 6–12 h, SRT 20–40 days, design flux 10–20 LMH at 10–30 kPa suction, mixed liquor 8,000–12,000 mg/L. MBR removes residual COD to <50–80 mg/L, nearly all TSS, and a meaningful fraction of color. The flat-sheet geometry of a DF series flat-sheet MBR module tolerates the residual hair and fiber that would blind a hollow fiber in days.
Step 4 — UF + RO polish. UF (0.01–0.05 µm) protects the RO from any MBR break-through or slug of biomass; a HydropureWater industrial RO then delivers permeate at <50 µS/cm conductivity, COD <10 mg/L, and color below detection. RO system recovery is targeted at 65–75% per pass, with the concentrate feeding a brine evaporator/crystallizer for 95–98% overall water recovery. The CIP skid is shared, sized once for the full train.
Container Count and Sizing: Translating m³/day into Skids
A 40-ft containerized MBR (12.2 m × 2.44 m × 2.9 m) typically handles 200–500 m³/day at the design envelope above; smaller mills in the 50–200 m³/day range use a 20-ft skid. Equalization always adds one container (20-ft or 40-ft depending on HRT) because the 8–12 h buffer is non-negotiable on batch-dye duty. DAF and MBR usually share a container or sit on adjacent skids when flows exceed 300 m³/day. When UF and RO are included, allow one 40-ft container per 200–300 m³/day of RO capacity plus a separate CIP skid and a clean-in-place chemical tote. The footprint of a fully containerized 500 m³/day textile plant is typically 60–80% smaller than a civil equivalent — roughly 60 m² of plot for the containerized version versus ~250 m² for a civil activated-sludge plant of the same capacity (HydropureWater field data, 2026).
| Design flow (m³/day) | EQ container | DAF skid | MBR container(s) | UF + RO containers | CIP skid | Approx. plot footprint |
|---|---|---|---|---|---|---|
| 50–200 | 1 × 20-ft | 1 × 20-ft | 1 × 20-ft (small MBR) | Optional 1 × 20-ft | 1 × 20-ft | ~30 m² |
| 200–500 | 1 × 40-ft | 1 × 40-ft | 1 × 40-ft | 1–2 × 40-ft | 1 × 20-ft | ~60 m² |
| 500–1,000 | 1–2 × 40-ft | 1 × 40-ft | 2 × 40-ft | 2–3 × 40-ft | 1 × 40-ft | ~120 m² |
| 1,000–2,500 | 2–3 × 40-ft | 1–2 × 40-ft | 3–4 × 40-ft | 4–6 × 40-ft | 1 × 40-ft | ~250 m² |
These counts assume a single dye house stream at the influent envelope in Section 2; segregated streams (e.g., low-COD finishing rinse separated from high-COD dye-bath discharge) shift the numbers downward and improve overall economics. Engineers specifying a real plant should also pad the MBR count by 15–20% for a redundant train, or accept a smaller redundant skid for peak-flow events. A worked example for a 1,000 m³/day ZLD upgrade is given in the containerised MBR project case study (residential, but the count logic transfers).
Containerized MBR vs SBR vs DAF-Only: Which Train Fits Your Mill?
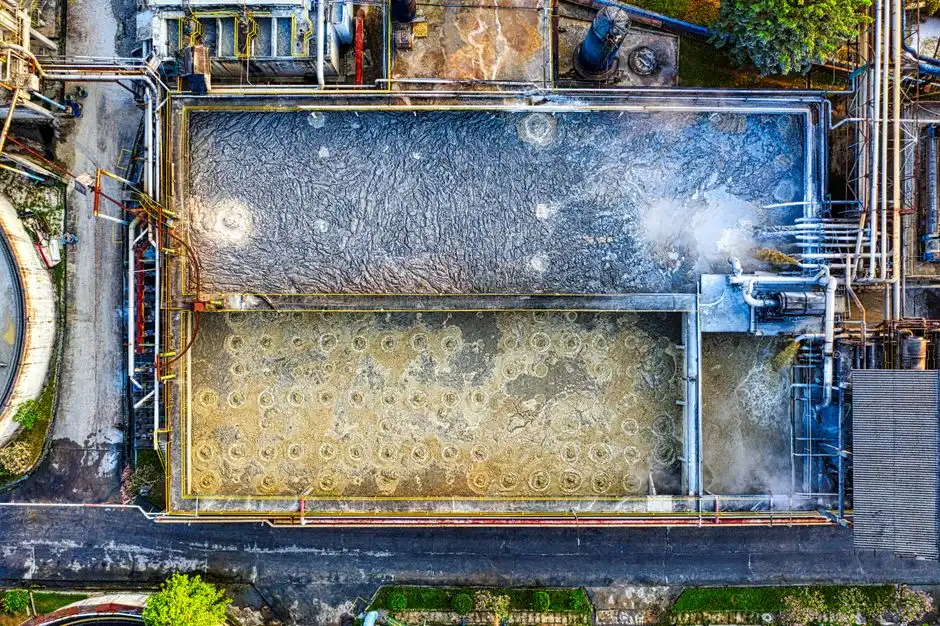
Three containerized formats are commonly offered for textile duty: DAF-only, SBR-in-a-container, and MBR (submerged PVDF), each with a different operating envelope. DAF-only is the cheapest option and works on TSS, FOG, and a meaningful fraction of color, but it cannot consistently deliver effluent COD <100 mg/L without downstream biology — it fits wash-water and finishing-rinse streams only. SBR in a container handles COD better than DAF-only because the biomass does the work, but the batch fill/decant cycle struggles to buffer the peak flows and toxicity slugs from reactive dye baths, and the footprint per kg COD removed is larger than MBR.
MBR (submerged PVDF) is the default for dye-house and printing effluent: steady-state biology combined with membrane filtration handles COD, residual color, and toxicity in a single containerized module. MBR + UF/RO is the only path that meets a 95–98% water-recovery target (Springer 2025) and the tight inlet specs of boilers or re-dyeing baths. For a deeper look at how DAF compares to induced-air flotation upstream of the same biology, the DAF vs IAF comparison is worth reading before locking the pre-treatment stage. The MBR operating envelope is also covered in the standalone MBR process explainer.
| Format | Typical effluent COD | Color removal | Footprint per m³/day | Reuse-ready? | Best fit |
|---|---|---|---|---|---|
| DAF-only | 300–600 mg/L | 60–80% | 0.05–0.1 m² | No | Wash-water, finishing rinse, pre-treatment only |
| SBR in container | 100–200 mg/L | 50–70% | 0.15–0.25 m² | No | Small mills, batch-compatible streams |
| MBR (PVDF) | <50–80 mg/L | 70–85% | 0.10–0.15 m² | No (discharge only) | Dye-house and printing effluent (default) |
| MBR + UF/RO | <10 mg/L permeate | >99% | 0.20–0.30 m² | Yes — 95–98% recovery | ZLD/MLD, water-scarce sites, re-dyeing |
2026 Effluent Targets, ZLD Economics and Compliance
Typical 2026 indirect-discharge limits for a textile plant under most state pollution control boards: COD <100–150 mg/L, BOD <30 mg/L, TSS <30 mg/L, color <50 Pt-Co, pH 6.5–7.5. Reuse targets are tighter: COD <50 mg/L, conductivity <50 µS/cm, hardness <20 mg/L as CaCO₃ for re-dyeing; TDS <10 mg/L and silica <0.5 mg/L for low-pressure boiler feed. A well-designed ZLD system using MBR + RO + brine evaporator/crystallizer recovers 95–98% of process water (Springer 2025); the remaining 2–5% leaves the site as brine or salt cake to landfill, or sold as a byproduct where grade allows.
OPEX drivers, in descending order at most mills: RO energy (0.8–1.2 kWh/m³ permeate), coagulant dose for DAF (typically 100–300 mg/L as PAC or 50–150 mg/L as FeCl₃), membrane cleaning chemicals (alkaline + acidic CIP every 1–4 weeks), and sludge haul-off. Sludge dewatering with a HydropureWater plate-and-frame filter press typically cuts sludge mass 70–90% and brings the cake to 30–40% dry solids, which directly shrinks transport cost; the sludge dewatering selection guide walks through polymer dose and cycle time for textile sludge. A chlorine dioxide generator or UV sterilizer is normally added as a final disinfection step before the reuse storage tank to control microbial regrowth in the recycled loop.
Frequently Asked Questions
How much wastewater does a textile mill actually generate?
A dye house processing 20 tons of fabric per day will generate roughly 800 m³/day of effluent at the EPA benchmark of 40 L of freshwater per kg of cloth. Larger integrated mills running multiple lines easily exceed 2,500 m³/day, and containerized trains scale linearly by adding MBR containers in parallel.
Can MBR alone meet textile discharge standards?
Yes for COD, BOD, and TSS — a properly operated MBR delivers COD <50–80 mg/L, TSS near zero, and 70–85% color removal. For reuse or to hit discharge color <50 Pt-Co in a single pass, a downstream UF/RO polish is required.
How many containers for a 500 m³/day textile plant?
A typical layout is 1 × 40-ft equalization + 1 × 40-ft DAF + 1 × 40-ft MBR + 1–2 × 40-ft UF/RO + 1 × 20-ft CIP — five containers on roughly 60 m² of plot. Segregating low-COD finishing rinse can drop the MBR to a single 40-ft and the RO to one 40-ft.
Is ZLD realistic for textile mills?
Yes. MBR + RO + evaporator/crystallizer routinely hits 95–98% recovery (Springer 2025), and the rest is salt cake. CAPEX is heavy — typically 1.5–2.5× the cost of a discharge-only plant — but water-scarcity tariffs, freshwater intake limits, and zero-discharge consent conditions justify it at most Indian, Chinese, and Middle Eastern sites.
What is the typical delivery and commissioning time?
8–14 weeks from PO for a containerized plant versus 12–18 months for a civil activated-sludge plant of the same capacity. Site work is limited to a concrete pad, power, and interconnecting pipework; the factory-built modules arrive pre-piped, pre-wired, and FAT-tested.