
Why Oslo Is a Different Wastewater Problem
Oslo municipal water drawn from the Maridalen and Glitre surface sources typically totals 30–80 mg/L TDS with calcium hardness of 10–25 mg/L as CaCO3 and silica around 2–5 mg/L (per Oslo Kommune VAV 2025 quality reports). That soft, low-mineralization profile means cooling-tower cycles of concentration (CoC) can theoretically reach 6–8 before calcium-based scaling, but silica becomes the limiting scalant at concentrations of 150–180 mg/L — well below the saturation point of calcium carbonate. Generic hyperscale water budgets written for Arizona or Singapore, where calcium and alkalinity dominate, misidentify the limiting salt and oversize the chemical-treatment program.
The climate changes the mass balance. Oslo's annual mean temperature sits between 0°C and 10°C, with 4,500–5,000 free-cooling hours per year on a typical 7°C wet-bulb threshold; evaporative loss from cooling towers effectively halts outside the May–September window. Operating case therefore rests on three levers, not the carbon argument: Oslofjord discharge permit volume caps, Oslo Kommune freshwater-stewardship expectations, and revenue from heat exported to the Hafslund district-heating network at 65–95 NOK/MWh (per Hafslund 2025 tariff schedule). Norway's grid is ~98% hydropower, so the carbon cost of pumping and treatment is negligible relative to the fjord-permit and freshwater economics.
Discharge to the Oslofjord is regulated by the Norwegian Environment Agency (Miljødirektoratet) under the Pollution Control Act (Forurensningsloven, 1983) and aligned with the EU Water Framework Directive (2000/60/EC). Typical permit parameters an Oslo data center must hit: discharge temperature delta ≤3°C above ambient fjord surface, TSS ≤10–35 mg/L depending on outfall, total nitrogen ≤6–10 mg/L at the mixing zone, and pH 6.5–9.0. Permit teams should expect site-specific limits for glycol from chiller loops and any facility-specific substances.
The Three Wastewater Streams an Oslo Data Center Produces
A 20–50 MW Oslo facility running evaporative cooling at 4–6 CoC produces three distinct wastewater streams that must be treated or metered separately to satisfy the discharge permit. Conflating them is the most common scoping error on Norwegian builds.
Stream 1 is sanitary wastewater from offices, kitchens, and restrooms — standard domestic strength with BOD 200–400 mg/L, TSS 200–350 mg/L, and total nitrogen 40–80 mg/L. A packaged biological plant handles it, sized to staff count, typically 1–80 m³/h.
Stream 2 is process wastewater: humidification bleed-off, AHU condensate, and RO reject if makeup is desalinated. Conductivity usually sits at 50–500 μS/cm with negligible BOD, but the stream runs warm (15–25°C) and is the cleanest candidate for reuse as cooling-tower makeup after polishing.
Stream 3 is cooling-tower blowdown (CTBD) — the largest stream by volume and the principal design driver. CTBD carries 20–40% of total site water intake (per Genesis Water Technologies, 2025) and is enriched in silica (80–150 mg/L), calcium hardness (200–400 mg/L as CaCO3), conductivity (1,500–3,500 μS/cm), and residual phosphonate/biocide from the treatment program. For a 100 MW site the total water demand can reach 2 million L/day (per IDE Water Technology, 2025), so the CTBD stream alone runs in the hundreds of m³/day.
A parallel "stream" worth specifying explicitly is heat. The Hafslund district-heating network accepts waste heat at temperatures from 25°C upward, and a 20–50 MW site can export 10–30 MW thermal at design conditions. This is a permit-enhancement lever, not a wastewater stream, but it belongs in the same mass-balance table because it changes how the permit team frames the project.
| Stream | Source | Typical Flow (20–50 MW) | Key Contaminants | Target Endpoint |
|---|---|---|---|---|
| Sanitary | Offices, kitchens, restrooms | 5–30 m³/day | BOD 200–400 mg/L, TSS 200–350 mg/L, TN 40–80 mg/L | On-site biological plant, fjord discharge |
| Process | Humidification bleed, AHU condensate, RO reject | 20–100 m³/day | Low TDS, 15–25°C, trace metals | Polished and reused as makeup, or fjord discharge |
| CTBD | Cooling-tower blowdown | 100–400 m³/day | SiO2 80–150 mg/L, Ca-hardness 200–400 mg/L, conductivity 1,500–3,500 μS/cm | Treated and recycled to cooling tower; brine to fjord |
| Heat export | Server exhaust, condenser water | 10–30 MW thermal | n/a | Hafslund district-heating credit |
Treatment Train for Cooling-Tower Blowdown Reuse
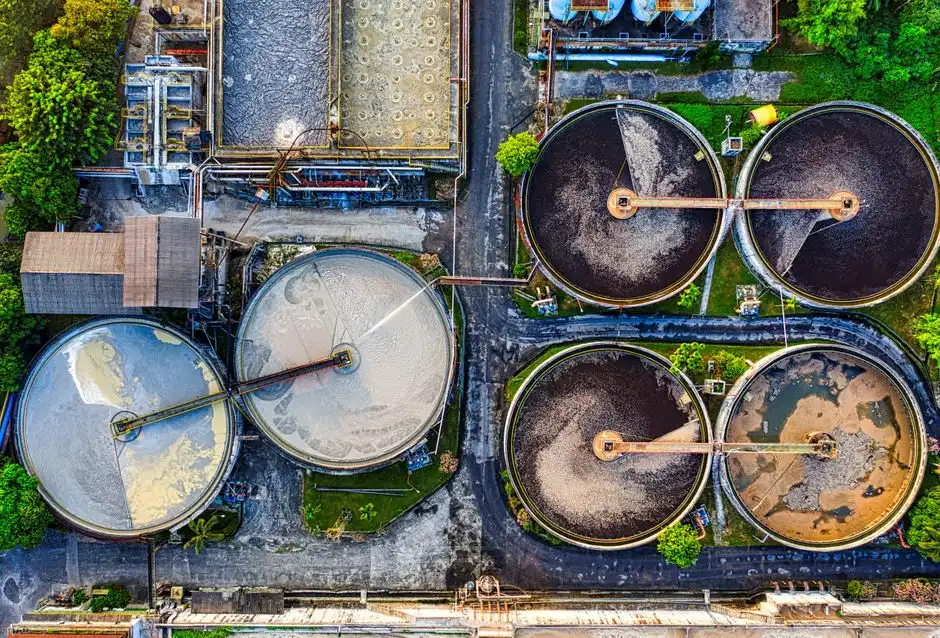
For a 20–50 MW Oslo facility the CTBD treatment train runs in seven unit operations, each sized to a flow range of 5–25 m³/h. Going below this envelope wastes CAPEX on underloaded membranes; going above it pushes recovery into the silica-scaling regime without brine polishing.
- Side-stream screening and equalization — 1–2 mm wedge-wire screens protect downstream equipment; an equalization tank sized to 4–8 hours of peak flow dampens diurnal variation from chiller staging.
- DAF or lamella clarifier — a DAF clarifier for cooling-tower blowdown pretreatment removes suspended solids, oils, and metal-hydroxide floc carried over from the cooling-water treatment program. Typical DAF capacity range is 4–300 m³/h, with air-to-solids ratios of 0.005–0.015 and surface loading of 5–25 m/h.
- Multi-media filtration — a multi-media filter for RO pretreatment with sand, anthracite, and garnet layers drops turbidity below 1 NTU. Backwash water recycles to the equalization tank.
- Ultrafiltration — a ultrafiltration skid for CTBD polishing at 0.03–0.1 μm pore size brings the Silt Density Index below 3, the standard RO feed limit. Skid sizes of 2,000–40,000 L/h are typical, with transmembrane pressure held at 0.4–1.2 bar and chemical-enhanced backwash every 20–60 minutes.
- Brackish RO at 75–80% local recovery — an industrial RO unit for blowdown recovery operated conservatively below the silica-scaling ceiling, producing permeate with SiO2 ≤1 mg/L and conductivity ≤50 μS/cm (per IDE Water Technology MAXH2O operating data, 2025). Permeate returns to the cooling-tower makeup tank.
- High-recovery brine polisher — a fluidized-bed crystallizer followed by a dynamic RO stage where silica, calcium carbonate, and calcium sulfate are precipitated onto seed material as compact pellets and the remaining NaCl-dominant brine is recycled in a closed loop. Overall recovery reaches 90–95% and fjord brine volume drops by 50–70% compared with single-stage RO.
- Disinfection of recovered water — UV at 30–40 mJ/cm² or chlorine dioxide at 0.2–0.5 mg/L residual handles the recovered water before it re-enters the cooling loop. Any potable-side cross-connection requires Cryptosporidium-grade treatment (per EPA LT2ESWTR guidance, 2006) — a 4-log inactivation target.
| Step | Unit Operation | Indicative Capacity | Key Target |
|---|---|---|---|
| 1 | Screening + equalization | 5–25 m³/h | <2 mm debris; 4–8 h buffer |
| 2 | DAF / lamella clarifier | 4–300 m³/h | TSS <30 mg/L out |
| 3 | Multi-media filter | 5–25 m³/h | Turbidity <1 NTU |
| 4 | UF skid | 2,000–40,000 L/h | SDI <3 |
| 5 | BWRO | 4–20 m³/h permeate | 75–80% local recovery; SiO2 ≤1 mg/L permeate |
| 6 | Brine polisher (FBC + dynamic RO) | 1–5 m³/h brine | 90–95% overall recovery |
| 7 | UV or ClO2 disinfection | 4–20 m³/h | 30–40 mJ/cm² UV; 0.2–0.5 mg/L ClO2 |
Handling Sanitary and Process Wastewater On-Site
The two smaller streams still need a defensible design or the permit team will not sign off. Sanitary wastewater from a 50–100 FTE data center runs 5–30 m³/day and is treated in a packaged buried A/O biological plant sized 1–80 m³/h, with effluent targeting BOD ≤20 mg/L and total nitrogen ≤10 mg/L to meet the Oslofjord permit envelope. Burial preserves the site footprint for landscaping or future expansion — a planning consideration on tight Oslo urban parcels.
Process wastewater and humidification bleed are low-strength and warm, which makes them candidates for either blending into the sanitary feed or polishing separately through an MBR system if reuse for cooling-tower makeup or toilet flushing is desired. A well-designed MBR delivers TSS <1 mg/L and BOD <5 mg/L at flux rates of 10–25 LMH, which lets the recovered stream substitute for a portion of freshwater makeup without scaling risk.
For hyperscale sites with permit conditions pushing toward zero liquid discharge, evaporator-crystallizer technology handles the residual brine as dry salts rather than fjord discharge — solids are typically <5% moisture and pass TCLP limits for non-hazardous disposal. Even a 50 MW site that runs evaporator-crystallization for only the final 5% of brine volume can eliminate the fjord-discharge line item entirely, which materially changes the permit conversation.
On-site treatment of all three streams eliminates tanker haul-off, removes the discharge-fee exposure under the Norwegian pollution regulations (Forurensningsloven §51), and gives the operations team continuous data logging for the yearly Miljødirektoratet compliance audit. Designers should also reference the chemical dosing system specifications guide when sizing antiscalant and biocide feed systems for the cooling loop.
Oslo Discharge Permit and Compliance Checklist
Miljødirektoratet sets the national framework under the Pollution Control Act, but the site-specific discharge permit is administered at the municipal level through Oslo Kommune's water and wastewater authority. For data centers, the permit will typically cover four parameter families that the design team must hit consistently, not just on commissioning day.
First, temperature. Fjord permits usually cap discharge temperature at 3°C above the ambient surface reading at the mixing zone, measured continuously during the May–September period. Second, total suspended solids, generally capped at 10–35 mg/L depending on outfall classification. Third, total nitrogen at the mixing zone, typically 6–10 mg/L. Fourth, pH 6.5–9.0, plus any facility-specific substances — glycol from chiller loops is the most common addition for data center permits, often with a 10–50 mg/L ceiling.
Oslofjord discharge volume caps are increasingly being written into permit conditions as brine minimization targets rather than absolute numbers, which is why a 90–95% recovery brine polisher is more than a sustainability preference — it is a permit precondition. On-site treatment with metering, automated reporting, and a documented operating envelope simplifies the yearly compliance audit and reduces the risk of permit revocation, which can shut down a 50 MW site in days.
Recent EU Best Available Techniques conclusions for waste treatment (BAT-AEL ranges under the 2018/1147 Implementing Decision) are now referenced in Norwegian permits even though Norway is not an EU member state, because the Water Framework Directive is implemented through the EEA Agreement. Designers should also be aware of the recent data center wastewater permit halt in Wyoming — a useful cautionary reference when discussing monitoring frequency and microbial controls with the permit team.
Cost, Payback, and Sizing for a 20–50 MW Oslo Site
For a 20–50 MW facility, the right-sized modular CTBD treatment system runs 100–300 GPM (22–68 m³/h) — the envelope where hyperscale economics start to apply and where modular standardization is realistic (per Genesis Water Technologies, 2025). Going smaller than 100 GPM inflates per-gallon CAPEX by 3–4×; going larger than 300 GPM pushes recovery past the silica ceiling without a brine polisher.
Indicative CAPEX for the CTBD treatment skid sits in the USD 200,000–600,000 band, scaling with flow, target permeate purity, and the inclusion of a brine polisher. A simple payback of 3–5 years is typical once avoided freshwater intake, avoided discharge fees, and any heat-recovery revenue are counted. The Genesis reference case used 60% recovery from 3 million gallons per year of CTBD and a USD 200,000 capital cost to calculate a 6.7-year raw payback that compressed to 3–5 years once avoided wastewater surcharges and water-cost inflation were included.
Oslo-specific economics stack favorably. Oslo Kommune industrial water rates run 35–55 NOK/m³, discharge fees to the fjord run 15–30 NOK/m³ of brine (per Oslo Kommune VAV 2025 tariff), and Hafslund pays 65–95 NOK/MWh for low-temperature waste heat. A 30 MW site that exports 15 MW thermal to district heating and avoids 200 m³/day of freshwater intake and 50 m³/day of brine discharge generates 8–14 MNOK/year in combined savings, against a CTBD skid CAPEX of 2–6 MNOK. Simple payback compresses to 2–4 years in this scenario.
| Item | Value (Oslo 20–50 MW) | Source / Note |
|---|---|---|
| CTBD skid CAPEX | USD 200,000–600,000 (2–6 MNOK) | Scales with flow and brine polisher |
| Oslo industrial water rate | 35–55 NOK/m³ | Oslo Kommune VAV 2025 |
| Oslofjord discharge fee | 15–30 NOK/m³ brine | Oslo Kommune VAV 2025 |
| Hafslund heat-revenue | 65–95 NOK/MWh | Hafslund 2025 tariff |
| Combined annual savings (50 MW, 200 m³/day avoided intake) | 8–14 MNOK/year | Includes heat export at 15 MW thermal |
| Simple payback | 2–4 years (Oslo-specific) | 3–5 years generic per Genesis Water Technologies |
| Hyperscale vs. colocation per-gallon CAPEX | 3–4× lower at 100 MW than 5 MW | Modular scaling is critical |
Right-sizing matters. Hyperscale 100 MW treatment trains cost 3–4× less per gallon than 5 MW colocation builds, so modular scaling and shared infrastructure across phased builds is the single biggest lever on per-gallon economics. The effluent treatment plant design buyer's guide covers the modular selection framework in more detail.
Frequently Asked Questions
What wastewater and cooling blowdown treatment does a data center in Oslo, Norway need?
An Oslo data center in 2026 needs three parallel treatment paths: a packaged A/O biological plant for sanitary wastewater, polishing for humidification and condensate streams, and a full CTBD reuse train — screening → DAF → multi-media filtration → ultrafiltration (SDI <3) → BWRO at 75–80% local recovery → fluidized-bed brine polisher with dynamic RO pushing overall recovery to 90–95% — followed by UV or chlorine dioxide disinfection of the recovered water.
How much of a data center's water intake becomes cooling tower blowdown?
CTBD represents 20–40% of total water intake (per Genesis Water Technologies, 2025) and runs hundreds of m³/day at a 100 MW site whose total demand can reach 2 million L/day. At 4–6 cycles of concentration, the blowdown ratio is 17–25% of makeup flow, with the higher end of CoC limited by silica scaling at 150–180 mg/L.
What permits regulate data center discharge to the Oslofjord?
Discharge is regulated by the Norwegian Environment Agency (Miljødirektoratet) under the Pollution Control Act (Forurensningsloven, 1983) and the EU Water Framework Directive as implemented through the EEA Agreement. Typical permit limits are temperature delta ≤3°C, TSS ≤10–35 mg/L, total nitrogen ≤6–10 mg/L, and pH 6.5–9.0, with site-specific conditions for glycol and brine volume.
What is the typical payback for a CTBD reuse system at an Oslo data center?
Generic payback is 3–5 years once avoided freshwater intake, discharge fees, and chemical costs are counted (per Genesis Water Technologies, 2025). Oslo-specific payback compresses to 2–4 years because Oslo Kommune industrial water rates of 35–55 NOK/m³, fjord discharge fees of 15–30 NOK/m³, and Hafslund heat-revenue at 65–95 NOK/MWh stack into combined savings of 8–14 MNOK/year for a 50 MW site exporting 15 MW thermal.
Related Equipment
- UV disinfection for recovered cooling water — specifications, capacity range, and technical data