
Why Membrane Fouling Drives MBR Operating Cost
Membrane fouling prevention in MBR systems combines three operating layers: (1) sub-critical flux operation with relaxation/backwash cycles (e.g., 10 min filtration / 1.5 min relaxation); (2) continuous air scouring at the membrane surface to shear the cake layer; and (3) periodic chemical cleaning-in-place (CIP) using NaOCl and citric acid. Together, these extend membrane life, hold transmembrane pressure below threshold, and cut replacement frequency — the single largest OPEX line in any MBR plant.
Three OPEX lines collapse onto the fouling curve. First, CIP chemicals and the downtime they require: at industrial chemical prices, a single recovery CIP using 2,000 mg/L NaOCl plus 10 g/L citric acid on a 500 m³/day module train costs roughly 800–1,500 USD per event, and most plants run 4–8 recovery cleans per year. Second, aeration energy spent overcoming fouling: when biofilm consolidates on a flat-sheet module, operators raise coarse-bubble intensity to recover flux, and every 0.1 m³/m²·h increment translates directly into blower kWh. Third, membrane replacement, typically required every 5–8 years and priced at 80–150 USD per m² of installed area for PVDF. Springer 2025 frames biofouling as the long-standing pain point in aerobic MBRs, demanding continual chemical cleaning and shortening membrane material life (Springer 2025). The operational signal that ties these three lines together is transmembrane pressure (TMP): a clean submerged PVDF module sits at 5–10 kPa; once TMP crosses 30–40 kPa, fouling has shifted from reversible to irreversible, and only chemical CIP can recover flux — the cycle never returns to baseline. This article sequences a four-layer prevention program — biology → hydraulics → physical cleaning → chemical CIP — that engineers can deploy in 2026 to keep TMP out of that irreversible window. An integrated MBR system sized correctly is the first line of defense, because the hydraulic envelope is set at the equipment level, not retrofitted later.
The Four Foulant Classes in an MBR
Before adjusting any setpoint, an engineer needs a diagnostic vocabulary that maps a TMP profile to a root cause. Per Le-Clech and Springer 2025, MBR foulants fall into four classes that operate simultaneously but respond to different controls. Cake layer forms when suspended biomass — flocs, single cells, colloidal organics — deposits on the membrane surface under permeate drag. It is the visible, removable layer. Pore blocking is caused by particles and colloids down to roughly 0.04 µm, the size band that includes indigenous viruses; the 0.04 µm nominal pore size commonly used in MBRs is the reference point Chaudhry et al. (2015) used to attribute virus removal to the backwash cycle. Adsorption fouling occurs when soluble foulants bind directly to the PVDF polymer. Hu et al. (2012) showed that SMP with molecular weight 6–20 kDa and EPS biopolymers at 50–300 kDa preferentially accumulate on conventional MBR membranes, which is why "clean water" flux recovery is never complete. Inorganic scaling — CaCO₃, CaPO₄, struvite, metal hydroxides — precipitates where pH or concentration gradients exist at the membrane interface, especially in high-recovery or hard-water applications.
Among these, EPS and SMP dominate the long-term fouling curve. In AnMBR work, a critical aerobic granular sludge (AGS) size of 1–1.2 mm has been identified; above or below this window, fouling declines as granules move away from the size that bridges membrane pores (Springer 2025). This finding is directly relevant to aerobic granular sludge MBR operation, where granule selection criteria become a fouling lever. The second operating distinction is reversibility: reversible fouling is removed by backflushing or relaxation, while irreversible fouling is removed only by chemical cleaning (Judd 2010). That boundary is the engineering decision line that separates hydraulic control from CIP. Microbial monitoring adds a fingerprinting tool: mature biofouling layers are dominated by Proteobacteria and Chloroflexi, a community structure distinct from the mixed liquor and detectable by 16S sequencing (Weerasekara et al., 2019, cited in Springer 2025).
| Foulant class | Primary mechanism | Dominant size range / marker | Primary control lever | Reversibility |
|---|---|---|---|---|
| Cake layer | Deposition of biomass on membrane surface | Flocs > 10 µm | Air scour, relaxation | Reversible |
| Pore blocking | Colloidal and viral particles lodged in pores | 0.04–1 µm (incl. 0.04 µm viruses) | Backwash, pre-filtration | Partially reversible |
| Adsorption (EPS/SMP) | Soluble biopolymer binding to PVDF | SMP 6–20 kDa; EPS 50–300 kDa | SRT, F/M, CIP chemistry | Irreversible |
| Inorganic scaling | Precipitation of Ca/Mg salts and hydroxides | Sub-µm crystals | Acid CIP, antiscalant, recovery control | Irreversible (acid-recoverable) |
Layer 1 — Biological Controls: Manage the Mixed Liquor
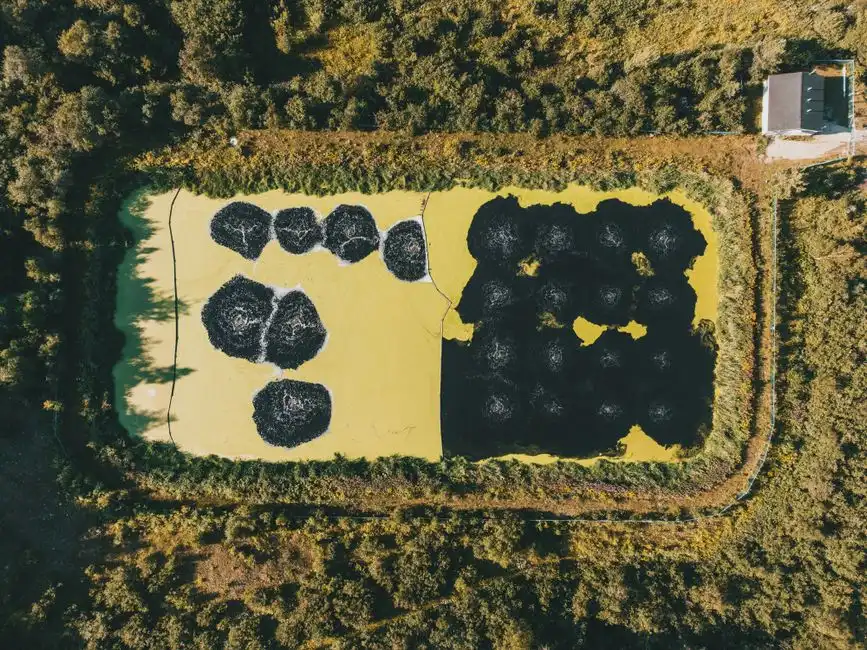
The cheapest fouling control sits upstream of the membrane, in the biology. Mixed liquor suspended solids (MLSS) is the first dial: 8,000–12,000 mg/L is the conventional operating band for submerged MBRs, and the viscosity-driven fouling penalty accelerates disproportionately above ~15,000 mg/L (Springer 2025). Below 6,000 mg/L, floc integrity deteriorates and releases more soluble EPS — moving the problem sideways rather than solving it. Solids retention time (SRT) governs EPS/SMP release: 20–40 days is the standard balance between complete nitrification and EPS accumulation. Longer SRT lowers SMP production but raises soluble EPS load, which means the optimum is site-specific and should be revalidated after any major influent change. Food-to-microorganism (F/M) ratio of 0.05–0.15 kg BOD/kg MLSS·day keeps flocs young and minimizes loosely bound EPS (LB-EPS) release; this is the most under-used parameter in routine operations.
Beyond the canonical levers, two proven lab-scale interventions are worth knowing. The bioflocculant GemFloc™ reduced SMP and improved the protein-to-polysaccharide ratio in SMP compared with a conventional MBR (Deng et al., 2020, cited in Springer 2025) — a higher protein/polysaccharide ratio correlates with lower fouling. Quorum-quenching (QQ) sheets delay biofilm maturation on the membrane by disrupting bacterial cell-to-cell signaling; pilots have shown QQ retarded fouling, although the same studies confirmed that low temperatures still trigger acute biofouling episodes (Lee et al., 2018). For cold-climate plants, Lei et al. (2021) showed that biochar addition to an AnMBR at 18 °C reduced cake foulant resistance while leaving gel-layer resistance comparable, an indication that the intervention targets cake rather than adsorbed EPS. None of these are silver bullets, but each trims a few kPa off the steady-state TMP and lengthens the run between cleans.
Layer 2 — Hydraulic Design: Sub-Critical Flux, Relaxation, Backwash
Sub-critical flux operation is the single most powerful hydraulic lever. The critical flux — the highest sustainable flux without long-term TMP rise — is determined empirically by a flux-stepping test. Operating at 60–70% of the critical flux gives a safety margin that accommodates mixed-liquor variability. Wu et al. (2008) showed that 3 min relaxation / 5 min backwash reduced cake growth relative to continuous filtration; Habib et al. (2017) refined this to 10 min filtration / 1.5 min relaxation, which minimized cake-layer resistance in aerobic MBRs. For high-rate submerged MBRs at 30 L/m²·h (Tabraiz et al., 2017), optimized relaxation/backwash frequency is the dominant control knob — flux and relaxation ratio together typically explain 70–80% of TMP variance in well-instrumented plants.
Cyclic aeration outperforms continuous coarse-bubble scour at the same average intensity. Pulsing the air supply disrupts cake before it consolidates, and the off-cycle allows sludge to fall away from the panel. This is why most modern MBR controllers ramp aeration on a 30–60 s cycle tied to the relaxation phase, rather than running a flat setpoint. One geometry-specific limitation: active backwashing is not valid for flat-sheet membranes because the plate geometry cannot be reverse-flushed without mechanical risk (Le-Clech et al., 2006, cited in Springer 2025). Flat-sheet modules rely on relaxation plus air scour plus CIP, and operators who treat them like hollow-fiber modules will shorten membrane life. For plants specifying flat-sheet geometry, a DF series PVDF flat-sheet membrane module is the relevant reference design; relaxation cycle timing becomes the parameter that does the work backwash does elsewhere.
| Parameter | Conventional aerobic MBR | High-rate submerged MBR | AnMBR (crossflow/sparged) |
|---|---|---|---|
| Sustainable flux (L/m²·h) | 15–25 | 25–35 | 8–15 |
| Operating flux / critical flux | 0.6–0.7 | 0.6–0.7 | 0.5–0.7 |
| Filtration : relaxation cycle | 10 min : 1.5 min | 8 min : 2 min | 30 min : 2 min (gas sparge) |
| Backwash viable? | Hollow-fiber: yes; flat-sheet: no | Hollow-fiber: yes; flat-sheet: no | Limited; rely on biogas sparging |
| Air-scour intensity (m³/m²·h) | 0.3–0.6 | 0.4–0.7 | 0.1–0.3 (biogas) |
Layer 3 — Physical Cleaning: Air Scour and Biogas Sparging
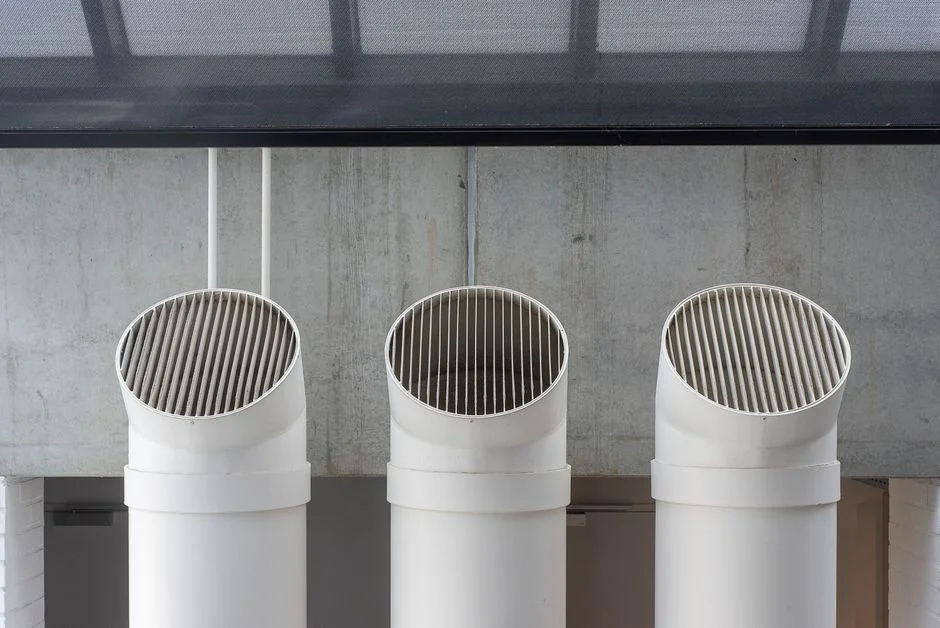
Continuous coarse-bubble aeration directly beneath an MBR module is engineering, not just "turn it on." Design intensity for aerobic submerged MBRs is 0.3–0.6 m³ of air per m² of membrane area per hour at the panel surface; below 0.25 m³/m²·h, cake control fails, and above 0.7 m³/m²·h the energy penalty outweighs the flux benefit. In AnMBRs, biogas sparging replaces air: digester gas is recycled to create crossflow at the membrane surface, typically 0.1–0.3 m³ biogas/m²·h, with a target superficial gas velocity around 5–10 cm/s at the membrane surface depending on module geometry. The hydraulic effect dominates the oxygen-transfer effect: sludge suspension and cake shear are the actual cleaning duties, and the oxygen delivered is a secondary benefit that may already exceed process demand.
Energy for membrane scour typically represents 30–50% of total MBR energy use (HydropureWater field data, 2026), which is why optimization has direct OPEX payback. Three field practices drive meaningful savings: (1) cyclic aeration synchronized with relaxation, as above; (2) blower turndown tied to TMP slope, not just to a fixed setpoint; (3) placement of the air header in the manifold center rather than the tank end, which prevents the dead-zone cake that triggers premature CIP. Plants that implement these three typically cut blower energy 15–25% with no loss of flux.
Layer 4 — Chemical Cleaning: CIP Recipes and Frequency
A defensible CIP protocol uses concentrations and triggers the maintenance team can audit, not "clean periodically." Two regimes apply. Maintenance CIP runs weekly to monthly and uses 200–500 mg/L NaOCl at pH 10–11 for 30–60 minutes; this oxidizes organic foulants and proteins before they consolidate into irreversible fouling. Recovery CIP runs quarterly to annually and uses 1,000–3,000 mg/L NaOCl for 1–2 hours, followed by 10–20 g/L citric acid at pH 2–3 to dissolve inorganic scaling. The two-step sequence is non-negotiable: alkaline NaOCl first opens the organic matrix so the acid can reach the scale. For PVDF flat-sheet modules, NaOCl up to 5,000 mg/L is tolerated in principle, but the manufacturer's specific limit must be checked — typically 3,000–5,000 mg/L for short soaks at room temperature, lower at elevated temperature. HydropureWater membrane elements and replacement filters carry published compatibility data that should be referenced before deviating from standard recipes.
The trigger matters as much as the chemistry. TMP-triggered cleaning initiates when transmembrane pressure rises to 30–40 kPa from a clean-membrane baseline of 5–10 kPa; this avoids both under-cleaning (which lets fouling cross into the irreversible window) and over-cleaning (which wastes chemicals and accumulates membrane exposure to oxidative stress). Maintenance CIP typically resets TMP by 50–70%; recovery CIP by 80–95%. The unreturned remainder is the steady-state irreversible-fouling floor, and it grows each cycle — which is why membrane life is finite regardless of how well the protocol runs. Backwashing is also a virus-removal mechanism, with the backwashed membrane being the major contributor to total virus removal in full-scale MBRs at 0.04 µm nominal pore size (Chaudhry et al., 2015); CIP chemistry must therefore be sized for both flux recovery and disinfection integrity.
| Regime | Chemical | Concentration | pH | Soak time | Frequency | Target foulant |
|---|---|---|---|---|---|---|
| Maintenance CIP | NaOCl | 200–500 mg/L | 10–11 | 30–60 min | Weekly–monthly | EPS, SMP, biofouling |
| Recovery CIP — alkaline | NaOCl | 1,000–3,000 mg/L | 10–11 | 1–2 h | Quarterly–annually | Consolidated organics |
| Recovery CIP — acid | Citric acid | 10–20 g/L | 2–3 | 1–2 h | Quarterly–annually | Ca/Mg scale, metal hydroxides |
| PVDF max exposure (check OEM) | NaOCl | ≤ 3,000–5,000 mg/L | 10–11 | ≤ 2 h | Per CIP event | Oxidative damage limit |
Cold-Climate Operation: Compensating for the 10 °C Cliff
Winter fouling is the most common real-world MBR failure mode. In Nordic pilot work, permeability dropped 75% once sludge temperature fell below 10 °C (Gurung et al., 2017, cited in Springer 2025). Gao et al. (2022) tracked the AnMBR fouling cycle shortening from 23 days at 35 °C to 8 days at 15 °C in domestic wastewater operation. The root cause is physical and biological: cold raises mixed-liquor viscosity, increases sludge volume index (SVI), and triggers release of protein-rich SMP and EPS. Chen et al. (2022) showed the cold-induced fouling layer is dominated by proteinaceous SMP/EPS, which dictates the cleaning chemistry response.
A parameterized cold-climate protocol is implementable in 2026 without major capital. (1) Reduce MLSS by 15–20% from the summer setpoint to keep viscosity in band. (2) Increase coarse-bubble aeration intensity by 20–30% to maintain shear as viscosity rises. (3) Shorten CIP interval to 2–4 weeks and lead with alkaline NaOCl — the protein-dominant foulant responds to oxidation before acid chemistry. (4) Consider anaerobic biological heating via heat-exchanger on the recycle loop, or simple enclosure insulation around the membrane tank; either can lift operating temperature above the 10 °C cliff through the coldest weeks. (5) Optional aids: biochar addition to the mixed liquor (Lei et al., 2021) reduces cake resistance at 18 °C; quorum-quenching media slow biofilm maturation, though neither removes the underlying physics. Plants that follow this protocol typically hold winter TMP rise within 50% of summer baseline, versus a 200–300% rise in uncompensated controls. For broader context on seasonal operation and energy trade-offs, the AnMBR biogas recovery guide covers the temperature-energy coupling in more detail.
Matching the Prevention Program to Your Module Geometry
Protocol selection depends on module geometry. Flat-sheet modules (DF series) have no active backwash — the prevention program leans on relaxation, air scour, and CIP. The advantage is mechanical simplicity, individual element replacement, and tolerance of higher solids. The trade-off is that relaxation ratio becomes the dominant hydraulic setpoint. Hollow-fiber modules accept backwash, run lower air-scour intensity (finer bubbles suffice), but require periodic chlorine soak to control fiber sludging — biomass that accumulates between fibers and cannot be removed hydraulically. Submerged MBR is the standard configuration for municipal and industrial duty in the 10–2,000 m³/day range, and side-stream crossflow is reserved for high-solids AnMBR applications where in-tank scour is impractical. The HydropureWater integrated MBR system and the DF series PVDF flat-sheet membrane module are the reference designs for the geometry choices above; the engineering specifics for packaged plants are detailed in the packaged MBR plant selection guide, and cost/compliance framing for the South American market is in the MBR system engineering and cost guide.
Frequently Asked Questions
What aeration intensity should I run for an aerobic MBR?
0.3–0.6 m³ of air per m² of membrane area per hour at the panel surface, pulsed in sync with the relaxation cycle for best results.
What filtration-to-relaxation cycle ratio minimizes cake?
10 min filtration / 1.5 min relaxation, per Habib et al. (2017), with cake-layer resistance minimized versus longer or continuous filtration cycles.
How often should I run a recovery CIP on a flat-sheet MBR?
Trigger when TMP reaches 30–40 kPa from a 5–10 kPa baseline, typically every 3–6 months; in cold-climate plants, shorten to every 6–10 weeks.
What MLSS range gives the lowest fouling rate?
8,000–12,000 mg/L; above ~15,000 mg/L, viscosity-driven fouling accelerates disproportionately and undermines any hydraulic optimization.
What should I change first when winter fouling hits?
Reduce MLSS by 15–20%, raise aeration intensity 20–30%, and shorten the CIP interval to 2–4 weeks with NaOCl first to oxidize protein-rich cold-season foulants.