
Why Adhesive Wastewater Sludge Is a Separate Engineering Problem
Adhesive and PSA tape lines typically discharge 5–25 m³/h of wastewater (per the 2026 adhesive manufacturing wastewater treatment process guide), but the downstream dewatering train is sized on the dry-solids mass, not the liquid flow. Three structural problems from the liquid side carry directly into the sludge: colloidal stability from the surfactant-stabilized emulsion (zeta potential −30 to −50 mV), biomass toxicity from solvent carry-over above roughly 200 mg/L, and pH swings between 2 and 11 from acid-catalyzed resin washes alternating with alkaline cleaning steps.
Coater-cleaning cycles release intermittent slugs of uncured polymer, release agent, and surfactant that drive COD above 30,000 mg/L and TSS above 10,000 mg/L within minutes. A municipal activated-sludge plant sized for sewage collapses on the first solvent slug; the sludge stream it leaves behind is just as unmanageable, because float skimmings carry 5–10% of the original mass as emulsified polymer, and the biological WAS inherits a residual solvent and plasticizer load that defeats generic thickening and dewatering designs.
For this article, adhesive wastewater sludge means the combined stream: DAF float skimmings (15–25% of total dry mass) plus biological WAS from the anaerobic and MBR stages (75–85% of total dry mass). Float sludge is greasy, low in biomass, and polymer-heavy; biological WAS is mineralized, denser, and easier to thicken. Treating them as a single stream is the most common retrofit mistake on the sludge side.
2026 Discharge and Reuse Limits That Reshape the Sludge Train
The 2026 regulatory floor dictates how much mass is pushed into the dewatering stage. China's GB 8978-1996 second-class standard remains the most common project baseline: COD ≤150 mg/L, BOD ≤30 mg/L, SS ≤150 mg/L, pH 6–9. Plants serving European customers must also meet EU Industrial Emissions Directive 2010/75/EU BAT-AEL ranges for the surface-treatment of metals and plastics, while U.S. sites typically discharge under EPA 40 CFR Part 433 with a daily maximum O&G of 52 mg/L and TSS of 60 mg/L — both stricter than the Chinese second-class envelope for the same parameters.
In 2026, Jiangsu and Zhejiang tightened permits in sensitive watershed districts to TN ≤40 mg/L and TP ≤2 mg/L, and the Yangtze River Economic Belt enforces a COD ≤50 mg/L ceiling for new plants near source-water zones. Those nutrient limits change the sludge mass balance directly: tighter TN and TP push operators toward extended biological treatment, higher MLSS, and longer SRT, which in turn produces more WAS per m³ treated and raises the dry-solids load sent to the press.
Operators must confirm against the local 2026 integrated discharge standard before freezing a design, as the gap between GB 8978-1996 and a Jiangsu or Zhejiang sensitive-district permit is the difference between a 0.6 kg DS/m³ press loading and a 1.5 kg DS/m³ press loading on the same line.
Stage-by-Stage Sludge Mass Balance on a 10 m³/h PSA Tape Line
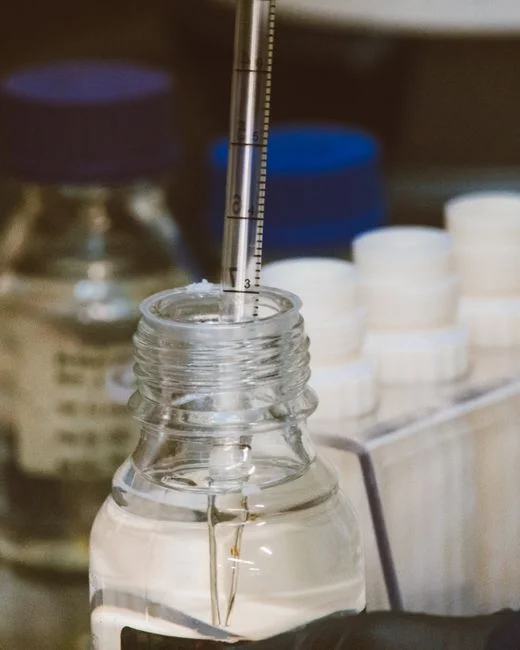
The sludge mass balance for a 10 m³/h acrylic PSA tape line at 18,000 mg/L influent COD is as follows:
| Parameter | Value | Source / Basis |
|---|---|---|
| Influent flow | 10 m³/h | S2 reference case |
| Influent COD | 180 kg/h (18,000 mg/L) | S2 reference case |
| Influent TSS | ~45 kg/h | S2 envelope |
| Influent emulsified polymer | 10–30 kg/h (500–3,000 mg/L band) | S2 envelope |
| DAF float sludge (wet) | 30–50 L/h at 3–6% DS | 0.3–0.5% of influent flow; 15–25% of total DS |
| DAF float DS | 1–2.5 kg DS/h | Float-skim fraction per S2 |
| Anaerobic + MBR WAS | 13–40 kg DS/h (wet before thickening) | 0.05–0.15 kg DS per kg COD removed; 85% COD removal |
| Total DS to dewatering | 8–15 kg DS/h | ~0.8–1.5 kg DS per m³ influent |
| Wet cake at 30% DS | 27–50 kg/h | 0.8–1.5 kg DS/h ÷ 0.30 |
The float-sludge fraction is the most variable term because surfactant carry-over from coater-cleaning swings it day to day. On a well-run line the float fraction lands near 15%; on a line with poor equalization it can push 25% or higher and overload the DAF system for emulsified polymer removal and downstream press in equal measure.
Thickening the Biological WAS Before the Press
A high-efficiency lamella thickener at 20–40 m/h surface loading cuts downstream press loading by 30–40% and is the standard 2026 choice for adhesive WAS. Polymer conditioning on the thickener runs 2–6 g/m³ of anionic polyacrylamide (PAM) — the same OPEX band that appears on the press, so the total sludge-side polymer demand on a Train B line typically lands at 4–12 g/m³ when thickening and dewatering are summed.
Float sludge from DAF is handled separately: it is too greasy for a gravity thickener and goes direct to a decanter centrifuge feed or to the press feed well, where it blends with thickened WAS. When the upstream MBR runs at high SRT (above 30 days), WAS is more mineralized, dewaters more easily, and consumes less polymer — a knob the process engineer can turn to reduce both transport mass and gate fees downstream.
Dewatering Equipment Comparison: Plate Press, Decanter Centrifuge, Belt Press
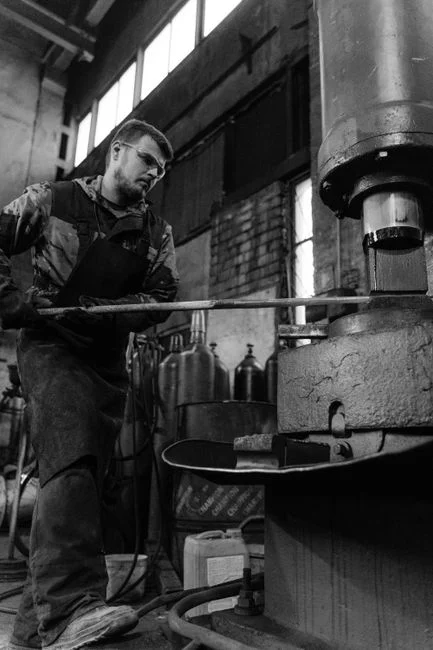
Selection logic for adhesive sludge starts with the cake DS target, not the equipment vendor. Landfill requires 25–35% DS for leachate stability; incineration or cement-kiln co-firing requires above 30% DS, often above 35% DS for autothermal combustion.
| Equipment | Cake DS (%) | Polymer demand (g/m³) | Duty cycle | Typical fit |
|---|---|---|---|---|
| Plate-and-frame filter press | 25–35 | 2–6 | Batch | Flows <20 m³/h; lowest CAPEX; standard 2026 endpoint |
| Decanter centrifuge | 22–30 | 3–8 | Continuous | Greasy float sludge; limited floor area |
| Belt press | 18–22 | 2–5 | Continuous | Lowest CAPEX; rarely meets 25% DS target |
A plate-and-frame filter press for adhesive sludge is the workhorse choice on the canonical 10 m³/h Train B line and matches the S2 dewatering envelope. Decanter centrifuges earn their place on lines with high float-sludge fractions or tight floor-area constraints, at the cost of 30–50% higher polymer use. Belt presses are usually disqualified for adhesive sludge unless the local landfill gate fee is very low and the 18–22% DS cake still passes the site's leachate criteria.
On the 2026 OPEX side, power across Train B runs 0.8–1.5 kWh/m³ and total OPEX is USD 0.6–1.8 per m³ treated; press polymer is the largest sludge-side variable cost after NaOH.
Sludge Disposal Routing in 2026: Landfill, Incineration, Reuse
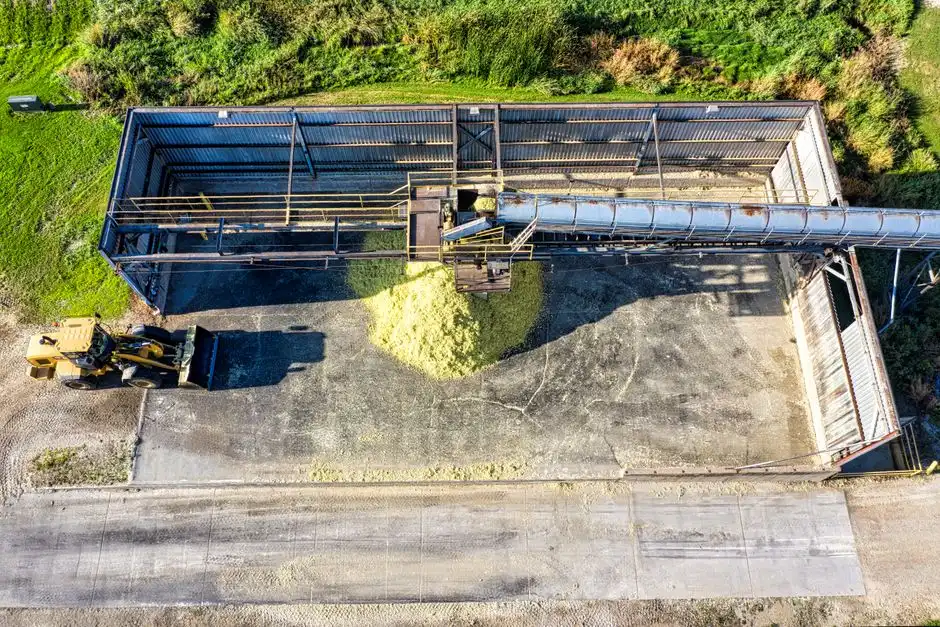
Landfill routing requires 25–35% DS cake to meet leachate stability; gate fees vary widely by province and are rising in 2026 as the Yangtze River Economic Belt restricts new landfill capacity. Incineration or cement-kiln co-firing needs above 30% DS, often above 35% DS for autothermal combustion; float sludge from DAF may need blending with WAS to hit calorific value, since pure float is polymer-rich and wet.
Reuse pathways are limited for adhesive sludge. Residual solvents (ethyl acetate, acetone, toluene) and plasticizers such as DOP and DINP rule out the protein-recovery route documented for paper-mill secondary sludge (BioResources, 2025-09), where recovered sludge protein yielded up to 23% of TSS and showed up to 41% of PF-resin shear strength. That pathway is built on a polysaccharide-and-protein biomass; polymer-emulation adhesive sludge is not the same feedstock.
The 2026 trend is more plants installing sludge dryers to push cake from 30% to 60–80% DS before off-site disposal, cutting transport mass by roughly half and converting a landfill line item into a smaller incineration or co-firing line item at a lower per-tonne gate fee.
Failure Modes Specific to Adhesive Sludge Handling
Four failure modes appear on most adhesive wastewater retrofits, and three of them hit the sludge train first:
- DAF foam carry-over dumps surfactant-rich float into the sludge line and overloads the press. Fix with anti-foam dosing (silicone or fatty-alcohol, 5–20 mg/L) and a 10–15 min pre-aeration cell upstream of the saturator.
- Anaerobic souring pushes pH below 6.5, kills methanogens, and sends poorly digested sludge to the press. The fix is a pH-locked equalization tank with a guaranteed 12 h buffer at peak flow.
- MBR membrane fouling by emulsified polymer sends uncoagulated polymer into WAS and bloats the press feed. Specify CIP every 2–4 weeks with 1,000–2,000 mg/L NaOCl plus 0.5–1% citric acid, and confirm the upstream DAF is sized at surface loading ≤15 m/h.
- UF flux decline leaves adhesive residues in the backwash stream and ultimately in the sludge line. Operate at cross-flow velocity ≥0.5 m/s with a 30-min backflush every 4 h, and install a rotary mechanical bar screen ahead of the UF feed to protect against fiber and polymer carry-over.
Frequently Asked Questions
What is the typical sludge yield for an adhesive wastewater treatment plant?
Anaerobic + MBR biological sludge lands at 0.05–0.15 kg dry solids per kg COD removed, with DAF float sludge adding another 15–25% of the total dry mass. On a 10 m³/h line at 18,000 mg/L COD with 85% removal, that translates to roughly 0.8–1.5 kg DS per m³ influent sent to dewatering.
Which dewatering equipment is best for adhesive sludge?
A plate-and-frame filter press and a decanter centrifuge both deliver the 25–35% DS target that landfill and incineration require; the press typically wins on polymer demand and cake dryness, the centrifuge wins on continuous duty and floor area. Belt presses rarely meet 25% DS on adhesive sludge and are usually disqualified.
Does the 2026 tightening of nutrient limits in Jiangsu and Zhejiang change sludge handling?
Yes. Tighter TN (≤40 mg/L) and TP (≤2 mg/L) push more biological uptake and more WAS into the dewatering stage, which raises polymer demand on the press and increases the dry-solids load per m³ of treated wastewater — typically moving a site from the 0.6 kg DS/m³