Why Perth is a 2026 Stress Test for Hyperscale Water
Perth's two shallow groundwater systems — Gnangara Mound and Jandakot Mound — have been over-allocated for two decades, with bore trends showing continuing decline through 2025 (DWER groundwater trend monitoring, 2025-09). Water Corp has run the Perth Desalination Plant at Kwinana since 2006 to backfill that gap, and seawater desal now supplies roughly half of scheme demand during dry summers. Even with that buffer, the metropolitan scheme sits in a hot, dry Mediterranean climate where Dec–Mar ambient peaks hit 35–40 °C and wet-bulb relief is thin, forcing evaporative cooling systems to cycle hard and bleed more. WSAA's December 2025 information paper notes Australian utilities are receiving hyperscale enquiries of 5–40 ML/day — 20× the largest existing industrial customer and equivalent to 70,000–80,000 households per facility (WSAA, 2025-12). IDE-Tech's 2026 reference puts a 100 MW facility at ~2 million litres per day of water demand, with cooling-tower blowdown (CTBD) the visible wastewater stream neighbours and DWER scrutinise first (IDE-Tech, 2026). Australian data centres already achieve Water Usage Effectiveness (WUE) as low as 0.01 L/kWh when blowdown is recycled back as cooling-tower makeup rather than discharged (WSAA, 2025-12) — but that target only holds if the treatment train is sized for Perth's specific feed-water chemistry and the concentrate pathway has a regulator sign-off behind it.
What Cooling-Tower Blowdown in Perth Actually Looks Like
Cooling-tower blowdown (CTBD) is the concentrated bleed pulled from the evaporative cooling loop to stop dissolved salts, treatment chemicals, and biocide residues from reaching saturation. At 4 cycles of concentration, blowdown is 25–30% of makeup water; for a 20 MW site consuming ~400 kL/day of scheme water, that is ~100–120 kL/day of CTBD to manage (per Genesis Water Technologies, 2026). Perth scheme water is unusually low-TDS and low-hardness compared with US Gulf or Middle East feeds, but carries meaningful silica and bicarbonate alkalinity, so the scaling risk is silica-driven rather than calcium-driven. CTBD TDS typically lands at 1,200–6,000 mg/L with elevated calcium, magnesium, silica, and accumulated biocides, scale inhibitors, and corrosion inhibitors (Genesis, 2026). Suspended solids run 10–50 mg/L from corrosion products, biofilm, and airborne dust, and Perth's winter wood-heater PM events plus spring dust storms periodically push TSS above that global band, which is why robust pretreatment is non-negotiable. CTBD also concentrates biocide residues — non-oxidising biocides and corrosion inhibitors upstream programs leave behind — and that chemistry compatibility matters for any downstream membrane or sewer-discharge consent.
| Parameter | Perth scheme water (typical) | Perth CTBD at 4–6 COC | US Gulf feed (benchmark) | Middle East feed (benchmark) |
|---|---|---|---|---|
| TDS (mg/L) | 120–250 | 1,200–6,000 | 1,500–4,000 | 5,000–15,000 |
| Total hardness as CaCO3 (mg/L) | 60–120 | 300–800 | 400–1,200 | 1,500–4,000 |
| Silica, SiO2 (mg/L) | 5–15 | 30–120 | 10–30 | 20–60 |
| Alkalinity as CaCO3 (mg/L) | 60–140 | 300–900 | 100–250 | 120–300 |
| Suspended solids (mg/L) | <5 | 10–80 (winter/spring spikes) | 10–50 | 10–50 |
| Dominant scaling risk | Low (silica-limited) | Silica + CaCO3 | CaCO3 + sulfate | CaSO4 + chloride |
Perth's feed silica of 5–15 mg/L concentrates 4–6× into the blowdown envelope, and silica is the species that most limits RO recovery beyond 80% without aggressive pretreatment (Genesis, 2026).
The Perth-Fit Treatment Train: Filtration → UF → RO → Concentrate Decision
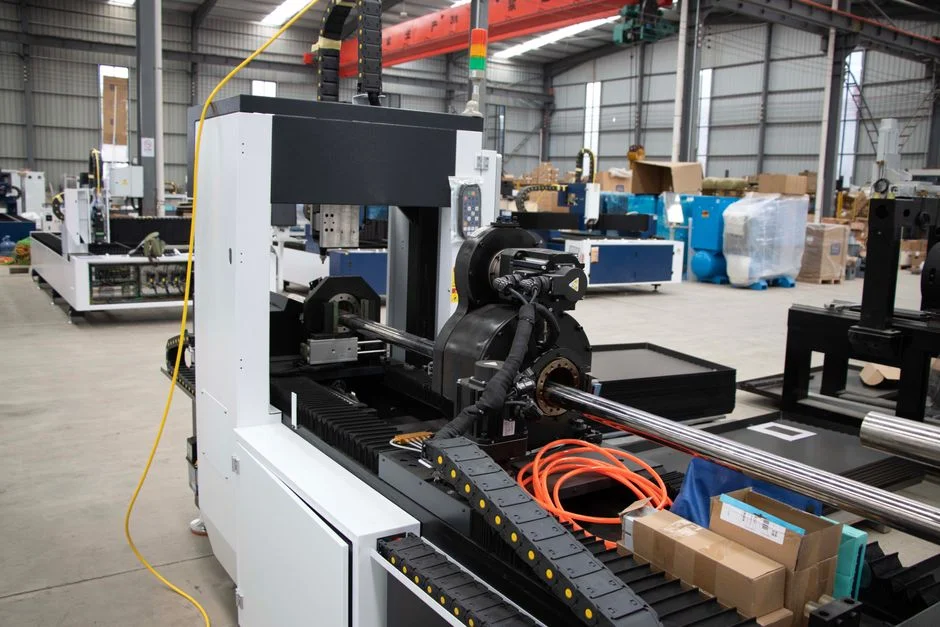
A defensible 2026 process train for a Perth hyperscale site has four steps, each addressing a specific stream characteristic before the next membrane stage sees the water.
- Side-stream filtration at 1–5% of circulation flow, 10–25 µm self-cleaning screens, drops CTBD suspended solids to RO-feed levels. A multi-media filter for CTBD pretreatment sized for the combined blowdown stream sits ahead of the membranes, with a CAPEX band of US $50K–$200K (Genesis, 2026).
- UF with 0.01–0.1 µm PVDF membranes as RO pretreatment, 90–95% UF-stage recovery, chemical cleaning every 1–3 months. An ultrafiltration RO pretreatment skid at 10–30 psi protects the RO from biofouling and colloidal silica carry-over.
- RO at conservative 75–80% local recovery, permeate 10–50 mg/L TDS suitable for direct reuse as cooling-tower makeup. An industrial reverse osmosis system for cooling-tower makeup runs at 150–400 psi with antiscalant tuned for silica and calcium carbonate. Where feed hardness or alkalinity drives scaling risk before silica does, an industrial water softener for hardness pre-stripping can be inserted ahead of RO to lift effective recovery.
- Concentrate management — the real decision: (a) mechanical vapour compression (MVC) at 95–98% recovery, 15–25 kWh/kgal, distillate <10 mg/L TDS; (b) brine concentrator where waste heat is available; (c) partial zero liquid discharge (ZLD) with crystalliser pushing to 99% recovery, US $3–8M CAPEX; (d) DWER-licensed sewer or outfall discharge if scheme allows (Genesis, 2026; IDE-Tech, 2026).
Operating pressure is the second-order lever most engineers miss: RO at 150–400 psi, nanofiltration (NF) at 75–150 psi, and UF at 10–30 psi. On a Perth 20 MW site the typical blended feed to the membrane train mixes humidifier bleed, chiller blowdown, and RO reject to keep downstream chemistry consistent. NF can sit between UF and RO where hardness rather than TDS drives the discharge limit, trading some permeate quality for lower pumping cost.
Three Realistic Process Trains for a Perth Hyperscale Site
The table below gives a design-review-ready comparison. CAPEX bands cover the blowdown train only, not the broader site water system, and the figures translate from Genesis's US benchmarks to AUD at parity for engineering-order-of-magnitude purposes only.
| Parameter | Train A — Compliance discharge | Train B — Internal reuse (typical Perth 2026) | Train C — Partial ZLD |
|---|---|---|---|
| Process | Side-stream filtration + softening + RO (75–80% recovery); brine to DWER-licensed outfall or trade-waste sewer | Same pretreatment; RO permeate blended back as cooling-tower makeup; MVC polish on RO concentrate to lift overall recovery to ~95% | RO + MVC + crystalliser targeting 95–99% recovery; manageable solid salt cake |
| Overall recovery | 75–80% | 90–95% | 95–99% |
| Freshwater offset vs once-through | 0% (blowdown exported) | 60–85% | 85–95% |
| CAPEX band (train only) | US $300K–$700K | US $1–3M | US $3–8M |
| OPEX per kgal treated | US $1.50–$3.00 | US $3–$6 | US $5–$15 |
| Discharge pathway | DWER-licensed outfall or trade-waste pre-approval | Minimal liquid waste; MVC distillate recycled | Solid salt cake; near-zero liquid discharge |
| Best fit | Inland Perth (Malaga, Hazelmere) where scheme allocation allows brine export | Coastal Perth (Henderson, Kwinana) with hyperscale cluster and reuse targets | Water-scarce sites or where DWER will not allow any liquid discharge |
Train B usually beats Train A on whole-of-life cost once avoided-discharge fees are included. Genesis flags direct discharge fees of US $5–$15 per thousand gallons in water-stressed regions (Genesis, 2026), and Perth's trade-waste tariffs sit in a comparable band once TDS triggers the high-strength surcharge. A 20 MW site producing ~120 kL/day of CTBD at 75% RO recovery yields ~90 kL/day of reuse water — equivalent to ~33 ML/year of avoided scheme demand, or the annual indoor use of roughly 220 Perth households.
Regulatory Hooks a Perth Data Centre Cannot Skip
The licensing sequence is as critical as the process train, and it starts before land is locked in. WSAA's first priority is to engage the water utility at the feasibility stage to confirm scheme allocation, peak-day reliability, and trade-waste discharge consent (WSAA, 2025-12). DWER's Department of Water and Environmental Regulation then handles a Section 5C (or equivalent) licence to take water plus a works approval for any on-site treatment plant producing brine, sludge, or condensate — the timeline in 2026 is typically 6–18 months once a complete application is lodged. Discharge to sewer triggers trade-waste pre-approval with the receiving wastewater utility, and some Australian jurisdictions now cap trade-waste TDS below 1,500 mg/L (per Genesis, 2026), which rules out raw CTBD discharge without pretreatment. Public reporting of WUE, PUE, and cumulative basin load is becoming a baseline expectation under the National AI Plan (December 2025), and WSAA's Priority 2 calls for transparent reporting as a community-trust condition (WSAA, 2025-12). Two site-selection variables deserve special attention: inland Perth (Malaga, Hazelmere) faces water-scarcity and complex discharge constraints, while coastal Perth (Henderson, Kwinana) can access recycled or desalinated water more easily but pays for it through higher land cost (WSAA, 2025-12). A related benchmark reference for the Latin American equivalent of this problem is the Rosario data centre blowdown treatment benchmark, and comparable engineering framing appears in the Córdoba data centre blowdown treatment benchmark and the Luanda data centre blowdown treatment benchmark.
Frequently Asked Questions
What WUE can a Perth data centre realistically target in 2026?
Australian data centres already achieve WUE as low as 0.01 L/kWh when CTBD is recycled back as cooling-tower makeup rather than discharged, per the WSAA December 2025 information paper. That figure is only credible if the blowdown treatment train is sized for the local feed-
Frequently Asked Questions
How much cooling-tower blowdown does a Perth data centre produce per megawatt?
A typical data centre in Perth operating with standard cooling tower efficiency produces between 1.5 and 3.0 cubic metres of blowdown per megawatt (MW) of IT load per day. This volume is highly dependent on the cycles of concentration (CoC) maintained; operating at 4 to 6 cycles—typical for high-efficiency evaporative cooling systems in the Western Australian climate—minimizes water consumption while keeping blowdown volumes within these ranges.
What water quality limits does DWER apply to data centre wastewater discharge in Western Australia?
The Department of Water and Environmental Regulation (DWER) regulates discharge based on the receiving environment, typically requiring compliance with the ANZG (2018) guidelines for fresh and marine water quality. Specific discharge permits often cap Total Dissolved Solids (TDS) at 1,000–2,000 mg/L, depending on the local sewer catchment or groundwater protection zone, and restrict heavy metals, biocides, and corrosion inhibitors to trace levels defined in the site-specific Operating Licence.
Can cooling-tower blowdown be reused as cooling-tower makeup, and what recovery rate is realistic in 2026?
Yes, blowdown can be treated via reverse osmosis (RO) or electrodialysis reversal (EDR) to be reused as cooling tower makeup water. In 2026, state-of-the-art treatment trains are achieving a realistic recovery rate of 75% to 85%, depending on the influent mineral scaling potential and silica concentration levels inherent in Perth's scheme water supply.
Do Perth data centres need a zero liquid discharge system, or is licensed discharge still allowed?
Zero Liquid Discharge (ZLD) is not currently mandated by state regulation for all data centres; however, it is increasingly required by local councils and water corporations for new large-scale developments in water-stressed corridors. Licensed discharge remains permitted provided the facility meets DWER’s stringent trade waste agreements and environmental management plans, which emphasize the reduction of saline discharge into local wastewater infrastructure.
How much does a data centre cooling-tower blowdown treatment system cost in Australia?
Capital expenditure for a modular blowdown treatment system ranges from $250,000 to $600,000 per MW of cooling capacity, depending on the complexity of the filtration train and the level of automation required. Operational expenditure, including membrane replacement, chemical dosing, and energy consumption, typically adds $0.80 to $1.50 per cubic metre of treated water, necessitating a rigorous lifecycle cost analysis against escalating local water and sewer discharge tariffs.