What MBR and CAS actually do inside a mining wastewater plant
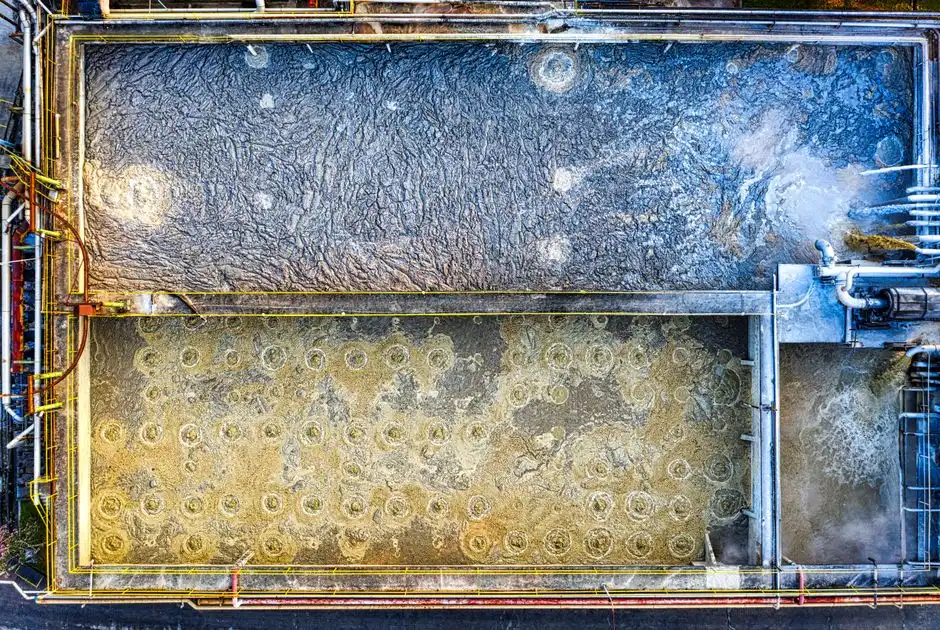
Conventional activated sludge (CAS) couples a biological oxidation stage with a gravity settling tank — the clarifier — where biomass aggregates into floc and separates from clarified effluent under quiescent conditions. Membrane bioreactor (MBR) replaces that clarifier with a submerged PVDF membrane module, typically operating at 0.1–0.4 μm nominal pore size, which physically retains biomass regardless of how well it flocculates (per Mannina et al., 2020; HydropureWater product catalog, 2026).
That difference matters more on a Missouri mining site than in a municipal plant. Influent pH on a lead/zinc or iron-ore operation can swing from 2.0 (acid mine drainage seeps) to 11.0 (CIP wash-down with caustic), and sulfate commonly runs above 2,000 mg/L. Free cyanide, residual xanthate, and dithiophosphate flotation reagents also show up intermittently. Those conditions disrupt floc aggregation in a clarifier far more than they stress a membrane — the membrane does not care whether the biomass flocculates; it only sees particles larger than its pore (per HydropureWater field data, 2026).
Sludge retention time (SRT) is the other large gap. MBR runs 30–60 day SRT versus 5–15 days for CAS, and mixed-liquor suspended solids (MLSS) sit at 8,000–12,000 mg/L in MBR versus 2,000–4,000 mg/L in CAS — roughly 3× more biomass per unit tank volume (per Mannina et al., 2020). The longer SRT lets slower-growing nitrifiers persist and degrades residual flotation organics that a short-SRT CAS system simply washes out. For an engineer sizing a new train, the practical takeaway is that the same biological load fits in a much smaller aeration tank with an MBR integrated wastewater treatment system than with a CAS train of equivalent effluent quality.
Effluent quality: who meets 40 CFR Part 440 in one pass
40 CFR Part 440 — Ore Mining and Dressing Point Source Category — sets the compliance ceiling for any Missouri mining discharge, with subparts that differ by ore type. Subpart 440.20 covers gold ore, 440.50 covers base and precious metals, and 440.60 covers iron ore; each subpart names a TSS monthly-average limit, a pH range, and a list of metals with daily-maximum and monthly-average ceilings for lead, zinc, copper, cadmium, arsenic, and mercury.
For a Linn Creek-area operation, the practical TSS ceiling falls in the 20–50 mg/L monthly-average range depending on subpart. MBR routinely delivers <5 mg/L TSS because the 0.1 μm physical barrier retains essentially all biomass and most metal-hydroxide fines (per HydropureWater product catalog, 2026). CAS, by contrast, depends on floc settleability; a pin floc event during a rain surge can push effluent TSS above 100 mg/L for hours and trip a monthly average.
Metals removal is not a biological function in either system — it happens upstream in lime, NaOH, or sulfide precipitation. What the secondary system controls is whether the precipitated fines actually leave the plant. MBR captures them; CAS clarifiers lose a fraction over the weir. The pH ceiling of 6.0–9.0 is also relevant: biological nitrification collapses below pH 5.5 and denitrification stalls above 9.5, and MBR's higher SRT recovers the biomass community within hours after an excursion where a CAS clarifier can lose its blanket for days (per HydropureWater field data, 2026). Fecal coliform is not a primary mining parameter unless a sanitary stream is co-mingled; if it is, MBR's complete solids retention gives near-zero coliform without a separate disinfection step.
| Parameter | 40 CFR Part 440 limit (typical subpart) | MBR expected performance | CAS expected performance |
|---|---|---|---|
| TSS, monthly avg | 20–50 mg/L | <5 mg/L | 10–30 mg/L steady; spikes >100 mg/L on upset |
| pH range | 6.0–9.0 | Operates 6.0–9.0; recovers from excursions | Operates 6.0–9.0; recovery can take 24–72 h |
| Total Pb, Zn, Cu, Cd, As, Hg | Subpart-specific (mg/L range) | Meets limits when upstream precipitation is operated correctly | Meets limits when upstream precipitation and clarifier both perform |
| Fecal coliform (if sanitary co-mingled) | Site-specific NPDES | Near-zero (physical barrier) | Requires separate disinfection |
Footprint and layout: the Linn Creek site constraint
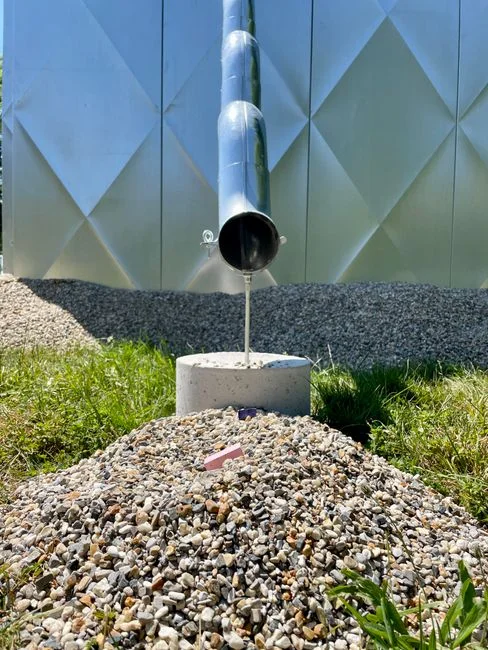
MBR delivers roughly 60% smaller footprint than CAS at equivalent loading because the membrane replaces a clarifier, a sludge thickener, and most of the return-activated-sludge (RAS) pumping building (per Mannina et al., 2020; HydropureWater product catalog, 2026). On a rural Missouri site where available ground is shared with haul roads, leach pads, stormwater routing, and a stormwater detention basin, that 60% cut is often the deciding factor rather than a nice-to-have.
Concretely, a 200 m³/day mine-water train needs 350–500 m² of process footprint in a CAS layout and 140–200 m² in an MBR layout. Higher MLSS (8,000–12,000 mg/L) shrinks the aeration tank volume for the same F/M ratio, and submerged flat-sheet modules need only about 1.5 m of headroom above the membrane rack — they can be retrofitted into an existing steel tank or a cast-in-place basin. A typical retrofit uses a DF-series flat-sheet MBR module cassette lowered into a refurbished aeration basin, which keeps civils cost down on brownfield sites around the Lake of the Ozarks watershed.
Operating reality: fouling, aeration, and operator burden
Membrane fouling raises transmembrane pressure (TMP) over time and forces a chemical clean-in-place (CIP) every 1–3 months on mining duty because metal hydroxide scale fouls the membrane surface faster than municipal biofilm does (per Mannina et al., 2020). Aeration energy runs 30–50% higher than CAS because blowers must supply both process oxygen and membrane-scour air. On a Linn Creek site, that means checking grid reliability or sizing a standby blower — a utility outage that stalls a CAS train for 4 hours is recoverable; one that stalls membrane scour for 4 hours can foul a cassette to the point of needing an unscheduled CIP.
The operator skill mix differs. MBR operators read TMP, permeability, and pressure-transducer trends; CAS operators read sludge volume index (SVI) and do microscopic exam for filamentous bulking. Both are real skills, and the burden is roughly comparable. One important note on sludge: metal-laden waste activated sludge is reportable as hazardous waste under RCRA in many cases regardless of which technology generated it, so the common claim that "MBR produces less sludge" rarely translates to a real disposal-cost advantage on mining duty. Where MBR does pay off operationally is on metal-shock days — a CAS clarifier can lose its blanket in 2–4 hours, while an MBR just keeps filtering through the upset. This is the most-cited reason mining operators give for switching. For sludge dewatering downstream, a plate and frame filter press typically drops metal-hydroxide cake to 35–45% dry solids, which lowers haul tonnage to a permitted disposal facility.
Side-by-side comparison: MBR vs CAS for mining duty
The table below is the scan-able summary an engineer can put in front of a plant manager or a Missouri DNR reviewer. Ranges are used so the values stay defensible across subparts of 40 CFR Part 440 and across ore types.
| Parameter | MBR | CAS |
|---|---|---|
| MLSS (mg/L) | 8,000–12,000 | 2,000–4,000 |
| SRT (days) | 30–60 | 5–15 |
| Effluent TSS (mg/L) | <5 | 10–30 typical; spikes >100 |
| Footprint for 200 m³/day | 140–200 m² | 350–500 m² |
| Capex (200 m³/day, US Midwest 2026) | $1.8–2.6M installed | $1.2–1.8M installed |
| Opex per m³ treated | $0.9–1.4 | $0.6–0.9 |
| Toxic-shock sensitivity | Low (membrane keeps filtering) | High (clarifier blanket loss in 2–4 h) |
| Reuse suitability | Direct to dust suppression / mill process | Needs tertiary polish (sand filter, UF) |
| Sludge production | Lower observed yield at long SRT | Higher yield; metal-laden either way |
| Direct GHG (kgCO₂eq/m³) | 0.91 | 0.85 |
Capex ordering: MBR is higher upfront because of membrane cassettes, scour blowers, and the CIP skid; CAS is higher in civils because of the clarifier, RAS pumping building, and usually a separate thickener. Opex ordering: MBR is higher in energy and membrane replacement (typical module life 5–8 years on mining duty); CAS is higher in polymer and sludge hauling. Lifecycle breakeven in the academic literature sits around 67 years (Karim & Mark, 2017, cited in Mannina et al., 2020) — far longer than any real mining permit.
Cost reality: capex, opex, and the 10-year mining-permit horizon
Order-of-magnitude installed cost for a 200 m³/day mine-water train in the US Midwest in 2026 is $1.2–1.8M for CAS and $1.8–2.6M for MBR (equipment + civils). Opex runs $0.6–0.9 per m³ for CAS and $0.9–1.4 per m³ for MBR, with energy and membrane replacement driving the gap. The capex premium for MBR is roughly $0.6–1.0M at this scale.
Where MBR closes that gap is reuse revenue. If the plant reuses more than 50% of treated water for dust suppression on haul roads or as mill process water, MBR's <1 μm effluent goes straight to reuse without a tertiary polish step. At Linn Creek-area water costs and hauling fees, a reuse credit of $0.30–0.50 per m³ avoided typically pays back the capex premium in 8–12 years — well inside a 10–20 year Missouri mining permit (per HydropureWater field data, 2026). Without a reuse path, pure OPEX usually favors CAS over a permit-length horizon, and the 67-year academic breakeven is irrelevant to a finite mine life.
Greenhouse-gas emissions are close: 0.85 kgCO₂eq/m³ for CAS versus 0.91 kgCO₂eq/m³ for MBR direct emissions (per Mannina et al., 2020). That 7% gap is real but not decisive for a mining NPDES permit, and it can flip in either direction depending on whether sludge is hauled to a distant disposal site or landfilled nearby.
Decision framework: pick the right technology for a Linn Creek site
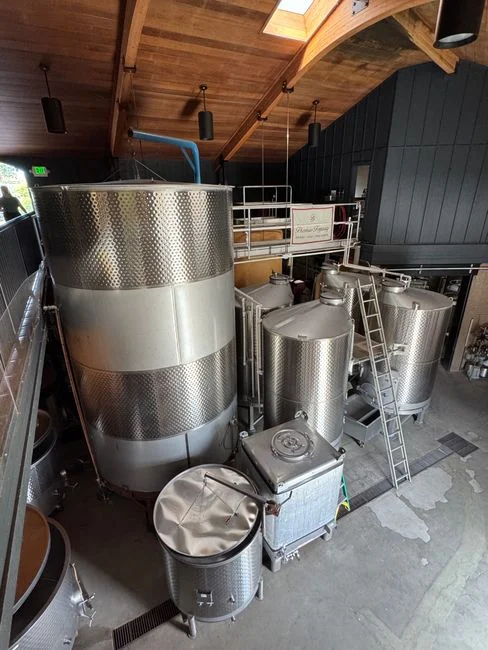
The honest answer is that neither technology wins everywhere on a mining site. Three archetypal scenarios cover most of what a Linn Creek-area engineer will see.
Scenario A — 100 m³/day iron-ore mine, stable influent, discharge to POTW. Choose CAS for lowest OPEX. The influent is steady, iron is already oxidized and settling in a pond, and discharge goes to a publicly owned treatment works (POTW) that does not need reuse-grade effluent. A lamella clarifier ahead of the aeration basin handles settleable fines cheaply, and the CAS OPEX advantage pays back the MBR capex premium in well under a permit cycle.
Scenario B — 150 m³/day lead/zinc mill with variable runoff, reuse for mill process. Choose MBR. Variable runoff means toxic-shock risk to a clarifier, and mill reuse means the <1 μm effluent is worth real money. DF-series submerged modules fit a 150 m³/day train in roughly 110–160 m², freeing the rest of the pad for stormwater detention.
Scenario C — 300 m³/day copper flotation with occasional tailings seepage. Choose MBR to survive the toxic shocks, and add a DAF unit upstream to remove emulsified flotation reagents before they reach the membranes. A plate-and-frame filter press downstream dewaters the metal-laden sludge to a haulable cake. For an apples-to-apples view of biological reactors in a different stress environment, the MBR vs CAS comparison for pharmaceutical wastewater walks through the same footprint math on a different influent.
Two common mistakes to avoid. First, do not pick MBR to avoid sludge — metal-laden waste sludge is reportable under RCRA regardless of which technology generated it, so this is rarely a real advantage. Second, do not pick CAS to save capex on a tight site where footprint forces a small clarifier that will fail on the first storm surge; the resulting consent-order cleanup cost will dwarf any capex saving. For operations that also handle chromium-bearing streams, hexavalent chromium treatment by sulfide precipitation is a relevant upstream polishing step that changes which downstream biological technology makes sense.
Frequently Asked Questions
Does MBR or CAS produce effluent that meets 40 CFR Part 440 in a single pass?
MBR does, routinely delivering <5 mg/L TSS against the 20–50 mg/L monthly-average ceiling in 40 CFR Part 440 subparts 440.20 and 440.50. CAS can meet it too, but only when floc settleability holds; a single upset can push monthly averages above the limit (per HydropureWater field data, 2026).
What is the real footprint difference between MBR and CAS for a 200 m³/day mine-water train?
About 60%. CAS needs 350–500 m² of process area; MBR with DF-series submerged flat-sheet modules needs 140–200 m² for the same load (per Mannina et al., 2020; HydropureWater product catalog, 2026).
How long does it take an MBR system to recover from a pH or metal spike on a mining site?
MBR's 30–60 day SRT preserves a nitrifier population that a 5–15 day CAS cannot hold, so recovery from a pH excursion back into the 6.0–9.0 NPDES range typically takes hours rather than the 24–72 hours a CAS clarifier needs to re-establish its blanket (per HydropureWater field data, 2026).
Is MBR or CAS cheaper to operate over a 10–20 year Missouri mining permit?
CAS wins on pure OPEX for the typical permit length. MBR's capex premium of roughly $0.6–1.0M for a 200 m³/day train is recovered only when reuse revenue or footprint constraints are binding; the academic 67-year breakeven (Karim & Mark, 2017) is not relevant to a finite mine life.
Which technology handles metal-laden sludge disposal better under RCRA?
Neither — once metal-laden biosolids exceed RCRA toxicity-characteristic thresholds, they are reportable hazardous waste regardless of whether they came from an MBR or a CAS clarifier. Sludge-handling cost is dominated by dewatering and hauling, where a complete MBR integrated wastewater treatment system paired with a plate press typically lands the cake at 35–45% dry solids.