
Why Atmore Chemicals Plants Are Re-evaluating Biological Treatment in 2026
Atmore sits inside EPA Region 4 and within the Gulf Coast petrochemical corridor that stretches from Mobile to Pensacola, so any biological-treatment decision on a chemicals wastewater stream is gated by 40 CFR Part 419 — the federal Effluent Limitation Guidelines (ELGs) for the petroleum refining category, which most adjacent chemicals facilities discharge under either directly or as the engineering reference set ADEM uses when writing permit limits. Part 419 currently regulates eight parameters: BOD5, TSS, COD, oil and grease, phenolic compounds, ammonia, sulfide, and total chromium (the only metal in the rule), as confirmed in Section 2.1 of the EPA's Detailed Study of the Petroleum Refining Category (EPA 821-R-19-008, 2019-09). Both MBR and CAS remain BAT-acceptable end-of-pipe technologies inside that rule, and the EPA's 2019 review of 129 refineries (Table 5-5) found that activated-sludge variants still dominate U.S. refining and chemicals wastewater treatment in place.
What has changed for Atmore operators is the permit-renewal cycle and storm resilience. ADEM permit renewals in 2024–2025 have pushed tighter monitoring on ammonia (PSES 100 mg/L) and phenols, and Hurricane Sally (2020) exposed how exposed clarifiers and open aeration basins are to windblown debris, power loss, and biomass washout during restart. A sealed, compact MBR footprint — typically ~60% smaller than CAS at equal flow per HydropureWater product data — handles both pressure points at once. The decision between retrofitting an existing CAS basin and installing a new MBR therefore is rarely a technology-fashion call; it is forced by what the renewed permit and the next storm season will allow the plant to discharge.
MBR vs Conventional Activated Sludge: How the Two Processes Actually Differ
Conventional Activated Sludge (CAS) treats wastewater in an aeration tank where heterotrophic bacteria flocculate and oxidize organics, then separates biomass from the clarified supernatant in a downstream secondary clarifier under gravity (Mannina et al., 2020). The clarifier is the weak link: it depends on settleable floc, it leaks suspended solids during hydraulic surges, and it occupies roughly half the footprint of a CAS plant.
A Membrane Bioreactor (MBR) keeps the same biology but replaces the clarifier with a submerged ultrafiltration cassette, typically PVDF flat sheet with a nominal pore size of 0.1 μm (HydropureWater product data for the DF series module). Per Mannina et al. (2020), MBR delivers four mechanistic advantages: (i) higher achievable SRT because biomass is no longer lost in the clarifier overflow, enabling enrichment of slow-growing degraders; (ii) lower observed cell yield at long SRT, so less waste activated sludge is produced per kg COD removed; (iii) a physical barrier that physically excludes suspended solids and most bacteria from the permeate; and (iv) much smaller solid/liquid separation volume because MLSS can be pushed to 8–12 g/L versus 2–4 g/L in CAS.
MBR's two documented disadvantages are membrane fouling — which raises transmembrane pressure and forces periodic chemical cleaning — and the additional energy demand for scouring aeration, which Mannina et al. (2020) measure in a head-to-head plant-wide model as roughly 0.4–0.8 kWh/m3 of extra blower load. The immersed flat-sheet configuration matters here: a DF series module with an integrated aeration box has been shown to use 10–20× less energy than external cross-flow MBR designs, which keeps the operating-cost premium manageable for Atmore-scale flows. Engineers comparing the two configurations at procurement should look at the integrated MBR system with submerged PVDF membranes and the DF series PVDF flat sheet membrane module as concrete reference points for an Atmore flowsheet.
Removal Performance on the Parameters 40 CFR 419 Actually Regulates
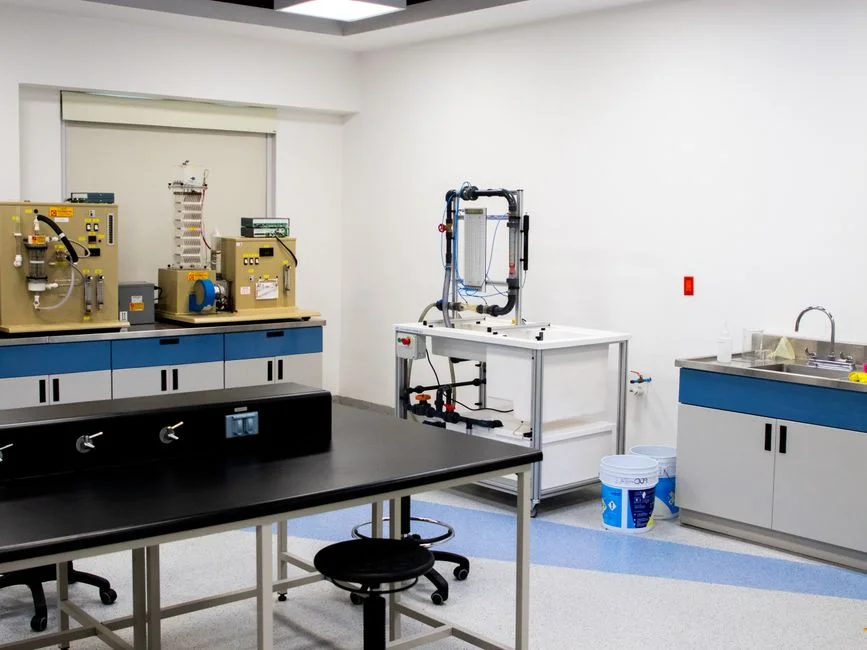
Compliance — not novelty — drives the Atmore decision, so the right comparison is parameter-by-parameter against the eight pollutants in 40 CFR Part 419. The numbers below are taken from the comparative dataset published by BenchChem (2026-04) and cross-referenced to the 40 CFR 419 limits in the 2019 EPA Detailed Study (Section 2.1).
COD. MBR delivers 84% to >95% removal versus 53% to 88% for CAS. The wider CAS range reflects sensitivity to sludge settleability; the tighter MBR range reflects the absolute TSS barrier. Both can usually meet the 40 CFR 419 COD mass limit, but MBR's higher floor gives a real margin against shock loads.
BOD5. MBR sits at ~98%; CAS ranges 68% to 96%. MBR's extra margin matters for indirect discharges to a POTW where the local limits are tighter than the federal ELG floor.
TSS. This is the single largest differentiator: MBR approaches 100% (the 0.1 μm membrane physically excludes essentially all floc), while CAS averages around 69% and can exceed 100 mg/L in the effluent during a bulking event. For a chemicals plant considering RO polishing downstream, MBR permeate is already RO-protective; CAS effluent typically needs tertiary multimedia filtration first.
Total nitrogen / ammonia. MBR achieves ~75% TN removal thanks to the long-SRT nitrifier population; CAS averages 38% on ammonia alone. The 40 CFR 419 PSES ammonia limit is 100 mg/L, and ADEM has been writing stricter monthly-median ammonia limits into recent renewals — long-SRT operation in an MBR is the lower-risk path.
Phenolic compounds. EPA's 1985 BAT revision lowered phenolic limits after refineries demonstrated attainable effluent concentrations, and slow-growing phenol-degrading genera (e.g., Pseudomonas, Acinetobacter) require long SRT to persist in the mixed liquor. MBR's typical 20–60 day SRT versus CAS's 5–15 day is the structural reason MBR holds a higher and more stable phenol removal efficiency.
Sulfide. Both systems oxidize sulfide biologically, but MBR's sealed/enclosed tank reduces H2S stripping to the atmosphere — a real ADEM community-impact consideration for any Atmore plant near a residential receptor. In-plant control (sour water stripping) remains the primary removal mechanism; MBR's contribution is containment of the residual.
Total chromium and oil & grease. Both rely on upstream precipitation (Cr) and API separation (O&G); 40 CFR 419 sets PSNS at 1 mg/L total Cr and PSES at 100 mg/L O&G. MBR's TSS barrier protects any downstream polishing step from fouling.
Direct greenhouse-gas emissions. Per Mannina et al. (2020), a plant-wide model gives 0.85 kgCO2eq/m3 for CAS versus 0.91 kgCO2eq/m3 for MBR — a real but small (~7%) environmental trade-off driven by MBR's extra aeration. Plants with carbon reporting obligations should account for it. For pH control and CIP chemical management on the MBR side, an automatic chemical dosing skid for CIP and pH control is the standard supporting unit.
Side-by-Side Parameter Table: MBR vs CAS for Atmore-Scale Flows
The table below consolidates the operating ranges and compliance-critical parameters into one scannable block for a procurement committee. Compliance-critical rows are flagged; numbers are drawn from BenchChem (2026-04) and Mannina et al. (2020); the reuse-suitability row uses HydropureWater product data for the 0.1 μm PVDF membrane specification.
| Parameter | MBR (submerged PVDF) | CAS (conventional) | 40 CFR 419 relevance |
|---|---|---|---|
| COD removal | 84% to >95% | 53% to 88% | Compliance-critical (BAT mass limit) |
| BOD5 removal | ~98% | 68% to 96% | Compliance-critical |
| TSS removal | ~100% | ~69% | Compliance-critical; enables RO reuse |
| Total nitrogen removal | ~75% | ~38% (ammonia only) | Compliance-critical at NH3 PSES 100 mg/L |
| SRT range (days) | 20–60 | 5–15 | Drives nitrification & phenol removal |
| HRT range (hours) | 4–8 | 6–12 | Tighter HRT aids footprint |
| MLSS range (g/L) | 8–12 | 2–4 | Higher MLSS shrinks tankage |
| Footprint index (500 m³/d plant) | ~200 m² | ~500 m² | Site-layout decision driver |
| Energy demand (kWh/m³) | 0.8–1.6 (incl. scour air) | 0.4–0.8 | MBR ~2× CAS aeration |
| CAPEX index (equal flow) | 1.4–1.8× | 1.0× (baseline) | Membrane modules drive delta |
| OPEX index (equal flow) | 1.1–1.3× | 1.0× (baseline) | Offset by lower sludge disposal |
| Phenol / sulfide / NH3 / Cr stress | Wins on phenol & NH3; sealed tank reduces H2S odor | Adequate; open clarifier vulnerable | Compliance-critical for all four |
| Reuse suitability (RO feed) | RO-ready directly (<1 μm permeate) | Needs tertiary multimedia filter first | Drives reuse economics |
Footprint, Energy, and Sludge: The Three Real OPEX Drivers
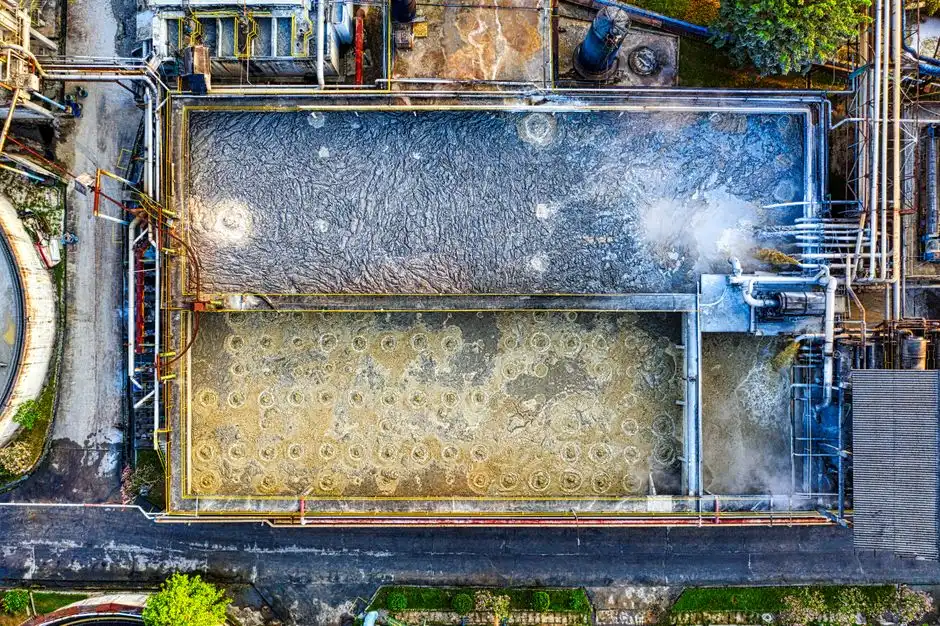
The procurement committee will weight footprint, energy, and sludge before they weight any other line item, because those three drive recurring OPEX and the permit-mandated dewatering step.
Footprint. HydropureWater product data puts MBR at roughly 60% of an equivalent CAS plant's footprint because the membrane cassette tank replaces the secondary clarifier and runs at 2–3× higher MLSS. Quantitatively, a 500 m³/day chemicals wastewater plant needs approximately 200 m² of biological-section footprint in MBR versus 500 m² in CAS — a 300 m² delta that on a tight Atmore site is often the entire available buildable area.
Energy. Mannina et al. (2020) found MBR energy demand systematically exceeds CAS because of scouring aeration, recycle pumping, and CIP chemical dosing. A defensible range is 0.4–0.8 kWh/m3 of additional electrical load over a CAS baseline of 0.4–0.8 kWh/m3, which roughly doubles the biological-section kWh/m³. The immersed flat-sheet configuration mitigates this versus external cross-flow MBRs; the integrated aeration box in the DF series module is the design choice that closes most of the gap.
Sludge. MBR's higher SRT lowers the observed cell yield, so the kg of waste activated sludge per kg COD removed is materially lower than CAS (Mannina et al., 2020). For a downstream dewatering step, the standard pairing is a plate and frame filter press for sludge dewatering; lower volumetric sludge output directly reduces filter-press cycle count and polymer consumption. The single largest MBR OPEX line item is membrane replacement, which the MBR spare parts OPEX breakdown for 2026 covers in detail.
Cost, Payback, and the Atmore Decision Rule
CAPEX for an MBR at equal flow typically runs 1.4–1.8× a CAS install, driven by membrane modules, stainless frames, and the CIP skid. OPEX runs 1.1–1.3× CAS, driven by the extra blower energy and CIP chemicals, but is partially offset by lower sludge disposal cost and by avoiding a tertiary multimedia filter if RO reuse is in scope. For an Atmore chemicals plant, that means MBR's higher first-cost is recovered only when one of three conditions is true:
- Flow is below roughly 200 m³/day. At low flow, MBR's CAPEX premium is small in absolute dollars, and the OPEX penalty is dominated by chemical cost rather than blower hours.
- The site has less than ~800 m² of buildable area for the biological section. When CAS simply will not fit, MBR is forced.
- The effluent must feed an RO skid for reuse. MBR permeate at <1 μm is RO-ready directly (per the DF series spec), whereas CAS effluent needs a tertiary multimedia filter first. Skipping that tertiary step closes a meaningful chunk of the CAPEX gap. See the integrated MBR system with submerged PVDF membranes paired with an industrial RO polishing skid as the reference configuration.
CAS remains the right answer when flow exceeds ~1,000 m³/day, the plant already has biogas capture or a carbon-reporting driver that rewards the 0.85 versus 0.91 kgCO2eq/m3 advantage (Mannina et al., 2020), and the site has spare land. A direct CAPEX/OPEX comparison for the parallel pharma case is given in the related footprint guide on MBR vs CAS for pharmaceutical wastewater, which uses the same engineering framework for a different waste profile.
Frequently Asked Questions
Is MBR or CAS better for chemicals wastewater in Atmore?
MBR outperforms CAS on every parameter 40 CFR Part 419 actually regulates: COD removal rises from 53–88% (CAS) to 84% to >95% (MBR), BOD5 from 68–96% to ~98%, and TSS from ~69% to nearly 100% (BenchChem 2026-04). The single biggest differentiator is TSS, which is what protects any downstream RO skid and what determines whether the effluent can be reused.
Does 40 CFR Part 419 require MBR?
No. The EPA's 2019 Detailed Study of the Petroleum Refining Category (Section 2.1) confirms that both MBR and CAS remain BAT-acceptable end-of-pipe technologies under 40 CFR Part 419. The 1985 BAT revision tightened phenolic-compound limits, and the 2019 study found both processes are installed across the 129 refineries reviewed (Table 5-5). The decision is site-specific, driven by permit limits, footprint, and reuse intent rather than by federal mandate.
What is the smallest flow where MBR pays back at an Atmore chemicals plant?
Below roughly 200 m³/day, MBR is the default choice: the absolute CAPEX premium is small, the OPEX penalty is dominated by chemical cost rather than blower hours, and the footprint advantage is most valuable at low flow where buildable area is typically constrained. Above 1,000 m³/day with biogas capture in place, CAS is often the better answer on both cost and the small GHG differential (0.85 vs 0.91 kgCO2eq/m3, Mannina et al. 2020).
How often do MBR membranes need replacement?
PVDF flat-sheet membranes in a properly operated immersed MBR typically run 5–8 years between replacements, with cleaning intervals driven by transmembrane pressure rise. The detailed OPEX breakdown — including module cost, CIP chemical consumption, and aeration overhead — is in the MBR spare parts OPEX breakdown for 2026.
Can an existing CAS basin be retrofit to MBR?
Yes. The standard approach is to keep the existing aeration basin as the biological reactor and add a downstream membrane cassette tank (with the DF series flat-sheet module as a reference design) plus a CIP skid. The secondary clarifier is decommissioned. This retrofit typically recovers 50–60% of the footprint benefit of a greenfield MBR at 40–60% of the CAPEX.