Why Paint and Battery Streams Decide This Differently
MBR vs MBBR selection at an EV plant depends on whether the wastewater originated from the paint shop or the battery cell coating line. Most gigafactories co-locate paint and battery operations on a single campus, requiring a hybrid effluent train to handle both streams effectively. Paint-shop blowdown carries high COD (1,500–6,000 mg/L), variable pH, and suspended pigments that an MBBR handles well as a roughing stage. Battery-cell process water presents a different problem: lower bulk COD (300–1,200 mg/L) but with fluoride, trace NMP and CMC binder solvents, and lithium and copper traces. The engineering scaffold for this comparison stems from the UPC hybrid MBBR-MBR textile study — which achieved 91% COD removal with MBR vs 82% with MBBR, and 99.4% TSS removal vs 73% — re-cast here for paint and battery characteristics. For a deeper cross-industry read, see the full MBR vs MBBR industrial comparison.
Paint-Shop Blowdown: MBR vs MBBR Side by Side
MBR systems deliver higher reuse-turbidity performance for paint-shop blowdown applications. An integrated MBR system with submerged PVDF membranes using a 0.1 μm PVDF flat sheet membrane module typically produces effluent turbidity below 1 NTU without downstream polishing, suitable for direct DI/RO makeup in paint-booth recirculation. MBBR effluent generally lands at 5–30 NTU even with a lamella clarifier or UF, as the clarifier cannot consistently retain fine pigment particles. Adapting the UPC textile figures to a paint-shop context, MBR delivers COD removal of 88–94% and TSS removal of 99+%, while MBBR alone delivers 78–86% COD and 70–78% TSS removal. MBBR reduces operator burden to a PLC loop and quarterly carrier inspection, whereas MBR requires weekly membrane integrity testing, monthly CIP with NaOCl and citric acid, and a membrane replacement cycle every 7–10 years (UtilityRadar, 2026). Choosing between these technologies requires balancing reuse requirements against maintenance resources.
| Parameter | MBR (paint-shop) | MBBR + clarifier/UF (paint-shop) |
|---|---|---|
| Influent COD | 1,500–6,000 mg/L | 1,500–6,000 mg/L |
| Effluent COD removal | 88–94% (est., UPC-adapted) | 78–86% (est., UPC-adapted) |
| Effluent TSS | <1 mg/L (membrane barrier) | 5–20 mg/L |
| Reuse turbidity | <1 NTU off membrane | 5–30 NTU after UF |
| HRT | 1.0–1.5 days | 0.8–1.2 days |
| Membrane CIP | Monthly NaOCl/citric | None |
| Membrane replacement | Every 7–10 years | N/A |
| Paint-booth recirculation reuse | Direct with RO polish | Needs RO polish |
Battery-Cell and Gigafactory Process Water: MBR vs MBBR
Membrane polishing provides essential performance for battery-cell process water despite higher operator costs. Although influent COD is lower than in paint-shop streams, the water contains fluoride, trace NMP and CMC binder solvents, and lithium and copper traces, requiring tighter reuse targets for cooling-tower and CIP makeup. MBR’s 0.1 μm pore physically retains particulates and biomass-bound metals that an MBBR clarifier would pass, often reaching reuse-grade quality without a downstream RO step. Because battery plants already employ trained RO operators, the incremental maintenance overhead of MBR becomes manageable. NMP and electrode-coating solvents pose a fouling risk to PVDF membranes, making a pre-MBBR roughing stage the standard 2026 configuration for battery lines, supported by September 2026 reporting on material-specific fouling in semiconductor UF/RO. Closed-loop water reuse with membrane polishing is now the gigafactory norm. Recommended membrane fouling prevention strategies for battery streams include MBBR roughing, periodic relaxation, and scheduled maintenance CIP.
| Parameter | MBR (battery process water) | MBBR + UF/RO (battery process water) |
|---|---|---|
| Influent COD | 300–1,200 mg/L | 300–1,200 mg/L |
| Fluoride (post-precipitation) | <50 mg/L influent; biomass-bound removal | <50 mg/L; passes to UF/RO |
| Effluent turbidity | <1 NTU off membrane | 5–15 NTU after UF; <1 NTU after RO |
| Li/Cu trace removal | Biomass-bound, partial | Clarifier passes most; RO required for tight limits |
| Reuse outcome | Cooling/CIP makeup, often no RO | Needs UF+RO to match |
| Solvent stress (NMP/CMC) | High — pre-MBBR roughing required | MBBR handles it as designed |
| Closed-loop reuse ready | Yes (gigafactory norm 2026) | Yes, with added RO stage |
Cost, Footprint and Energy: Painting Real Numbers on the Trade-Off
Procurement and plant management decisions focus on CAPEX, footprint, and energy consumption per cubic meter. MBBR offers approximately 68% lower CAPEX than MBR with comparable OPEX at the unit-process level, according to adapted UPC textile data. MBR requires additional membrane scour energy and replacement costs every 7–10 years. While an MBR train occupies roughly half the footprint of conventional activated sludge (UtilityRadar, 2026) and MBBR is even more compact, the necessity of a downstream clarifier or UF polish for MBBR offsets some footprint advantages. MBR systems typically consume 0.6–1.2 kWh/m³ for scour aeration, compared to 0.3–0.6 kWh/m³ for MBBR. Co-located paint and battery plants running a hybrid MBBR-to-MBR train can share blowers and controls, optimizing plant-level costs. For market context on the MBR cost trajectory, see the 2026 MBR market growth and buyer outlook.
| Metric | MBR | MBBR (+ downstream clarifier/UF) | Hybrid MBBR→MBR |
|---|---|---|---|
| Relative CAPEX (UPC textile, adapted) | 1.0× baseline | ~0.32× (68% saving) | 0.7–0.9× |
| Energy (kWh/m³) | 0.6–1.2 | 0.3–0.6 | 0.5–0.9 |
| Footprint vs CAS | ~50% of CAS | ~30% of CAS (with downstream) | ~45% of CAS |
| Membrane replacement event | Every 7–10 years | None | Every 8–10 years (MBR stage) |
| Downstream polish needed for reuse | None for non-potable | UF/RO usually required | None for non-potable |
Operator Burden Scorecard: Who Actually Runs the Plant at 3 a.m.?
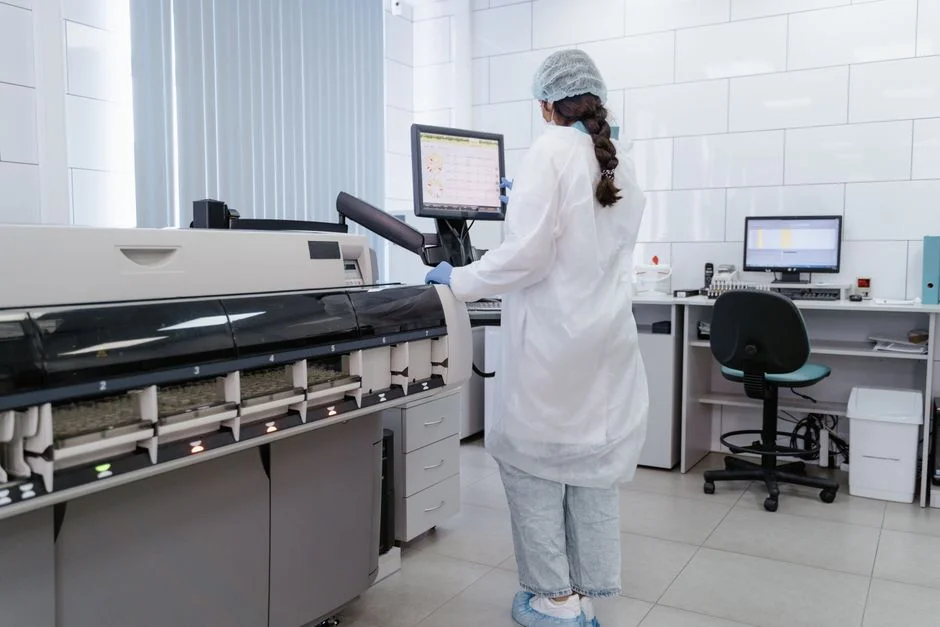
Staffing requirements vary significantly between MBR and MBBR technologies. MBR operation typically demands a Class III/IV-equivalent certified operator to handle weekly integrity testing, monthly CIP, and membrane replacements. MBBR operation requires a Class II/III operator, quarterly carrier screen inspections, and carrier top-ups, with no chemical CIP or membrane replacement. Scoring both on a 0–5 scale (0 = highest burden, 5 = lowest), MBBR requires more attention to chemical handling and consumables, while MBBR scores higher on ease of operation. However, MBR offers superior reuse-water stability and lower alarm frequency due to the membrane barrier. For facilities already operating MBRs in other departments, the burden is incremental; for paint-shop-only sites with smaller environmental teams, MBBR + UF is often the lower-risk choice. The 7-step MBR maintenance protocol provides further detail on operator requirements.
| Burden dimension (0=high, 5=low) | MBR | MBBR (+ UF polish) |
|---|---|---|
| Routine monitoring effort | 2 (daily TMP, MLSS, DO) | 4 (daily DO, weekly carrier check) |
| Chemical handling (CIP) | 1 (monthly NaOCl/citric) | 5 (none for biology) |
| Consumables & replacement events | 2 (replacement 7-10yr) | 4 (carrier top-up annually) |
| Alarm frequency (fouling, integrity) | 3 (TMP, integrity alarms) | 4 (carrier loss, DO alarms) |
| Reuse-water stability (3 a.m. risk) | 5 (membrane = absolute barrier) | 3 (clarifier upsets propagate) |
| Operator skill tier required | Class III/IV | Class II/III |
The Verdict by Site Configuration (2026 Selection Matrix)
Selecting the right technology depends on the site's specific reuse goals and configuration. Paint-shop-only sites without high-tier reuse targets benefit from the lower CAPEX and operator burden of an MBBR + lamella clarifier + UF configuration. Conversely, sites requiring paint-booth recirculation or closed-loop cooling reuse should prioritize MBR or a hybrid MBBR-to-MBR train to achieve sub-1 NTU turbidity. The hybrid configuration — effectively mirroring the UPC textile study’s results — is the 2026 default for co-located EV sites, as it manages COD and solvent swings in the MBBR stage while providing high-quality effluent through MBR polishing. For pre-treatment decisions, see the DAF vs clarifier for EV and auto wastewater guide, noting that DAF pre-treatment remains the standard for removing paint pigments and oil.
| Site configuration | Reuse target | Recommended 2026 train | Why |
|---|---|---|---|
| Paint-shop only, non-potable reuse | Cooling tower, toilet flush | DAF → MBBR → lamella → UF | Lowest CAPEX, lowest operator tier |
| Paint-shop with booth recirculation | DI/RO makeup | DAF → MBBR → MBR (or MBR alone) | <1 NTU reuse turbidity |
| Battery cell process water | Closed-loop cooling, CIP | Precipitate F → MBBR → MBR | Membrane barrier on Li/Cu traces |
| Co-located paint + battery, mixed reuse | Booth + cooling + CIP | DAF → MBBR → MBR | UPC hybrid at 1-day HRT, reuse-grade |
Frequently Asked Questions
Which is better for reuse-loop turbidity at an EV plant — MBR or MBBR?
MBR provides superior reuse-loop turbidity, typically delivering under 1 NTU off the membrane without downstream polishing, while MBBR followed by a clarifier or UF typically lands at 5–30 NTU. For paint-booth recirculation or closed-loop cooling reuse, this performance differential makes MBR or a
Frequently Asked Questions
Which is better for paint-shop wastewater at an EV plant, MBR or MBBR?
For paint-shop wastewater, MBR is generally superior due to the presence of complex polymers, surfactants, and heavy metals that require absolute solids separation. MBR technology consistently achieves complete retention of suspended solids and high-molecular-weight organic compounds, which is necessary to protect downstream Reverse Osmosis (RO) membranes from fouling.
While MBBR is effective for BOD and COD reduction, it does not provide a physical barrier to solids and often requires secondary clarification and ultrafiltration stages to reach the quality levels required for EV plant process reuse. Therefore, MBR is the preferred choice for facilities aiming for high-rate water reclamation in 2026.
What turbidity can MBR versus MBBR realistically deliver for reuse?
MBR technology consistently delivers a permeate turbidity of less than 0.2 NTU, which is the industry standard for reliable RO feed water. This level of clarity ensures that SDI (Silt Density Index) values remain below 3.0, protecting sensitive reuse systems from scaling and irreversible membrane damage.
In contrast, an MBBR system typically produces an effluent with a turbidity ranging from 5 to 20 NTU, depending on the efficiency of the secondary clarifier. Without an integrated tertiary filtration step, this effluent is generally unsuitable for direct reuse in high-purity EV plant applications, such as e-coat rinsing or battery electrolyte preparation.
How much operator time does an MBR need compared with an MBBR?
MBR systems require approximately 30% to 50% more operator attention than MBBR systems. Operators must manage automated chemical cleaning cycles (CIP), monitor transmembrane pressure (TMP) trends, and perform periodic physical membrane integrity tests to ensure the system meets reuse standards.
MBBR systems are mechanically simpler, requiring primarily the monitoring of dissolved oxygen levels, biofilm carrier retention screens, and sludge wasting rates. While MBBR is less labor-intensive, the lower maintenance burden is often offset by the additional labor required to manage the tertiary treatment systems needed to bring MBBR effluent to reuse-grade quality.
Is a hybrid MBBR plus MBR worth the extra cost for battery wastewater?
For battery wastewater, which often contains high concentrations of recalcitrant organics and fluoride, a hybrid system is highly effective. Utilizing an MBBR as a pre-treatment stage reduces the organic load on the MBR, which significantly mitigates membrane fouling and extends membrane life by 15% to 25% in high-salinity or toxic environments.
The extra investment is generally justified in battery manufacturing plants where wastewater characteristics are highly variable. By decoupling the biological degradation (MBBR) from the solid-liquid separation (MBR), the plant achieves higher operational stability and can better handle shock loads of hazardous constituents that would otherwise cause an MBR-only system to fail.
What is the typical CAPEX difference between MBR and MBBR for an automotive plant?
The initial CAPEX for an MBR system is typically 20% to 35% higher than that of a standalone MBBR system. This cost premium is driven by the requirement for membrane modules, automated backpulse systems, sophisticated permeate pumping stations, and advanced PLC control logic for membrane management.
However, when comparing total installed costs, the gap narrows significantly if the MBBR system requires tertiary filtration and secondary clarification to meet the same reuse water standards as the MBR. For automotive plants with strict zero-liquid-discharge (ZLD) or high-reuse mandates, the MBR often provides a better return on investment despite the higher initial capital outlay.