Durham-Specific Regulatory Framework: What Limits Actually Apply
Semiconductor facilities discharging to the City of Durham's sanitary sewer system must comply with local limits that are often more stringent than federal guidelines, necessitating robust pretreatment systems. The City of Durham Sewer Use Ordinance (SUO) Section 70-121 (2024 revision) establishes specific local limits for industrial users, including a fluoride discharge limit of 25 mg/L, which is stricter than the federal 40 CFR 469 (Semiconductor Subcategory) daily maximum of 32 mg/L for fluoride. Similarly, the local copper limit is 2.0 mg/L, while federal standards under 40 CFR 469 set a daily maximum of 2.7 mg/L for total copper, making the Durham limit more restrictive. Facilities must also adhere to a pH range of 6.0–10.0 SU and a total toxic organics (TTO) limit of 2.13 mg/L, which aligns with federal 40 CFR 469 standards.
Beyond local and federal baseline limits, the North Carolina Department of Environmental Quality (NC DEQ) mandates specific pretreatment permit requirements under 15A NCAC 02H .0200. These include submitting a 90-day baseline characterization report, developing a slug control plan, and implementing Best Management Practices (BMPs) for PFAS, as guided by the EPA's 2024 PFAS Strategic Roadmap. Significant industrial users, defined as those discharging over 25,000 gallons per day, must also submit quarterly self-monitoring reports. located within the Cape Fear River Basin, facilities may face additional total nitrogen allocation limits, potentially triggering more stringent ammonia or nitrate discharge requirements to mitigate nutrient loading in the watershed.
| Parameter | City of Durham SUO Local Limit (mg/L) | Federal 40 CFR 469 Daily Max (mg/L) | Notes |
|---|---|---|---|
| Fluoride | 25 | 32 | Durham is more stringent |
| Copper | 2.0 | 2.7 | Durham is more stringent |
| Nickel | 2.5 | 3.9 | Durham is more stringent |
| Ammonia (as N) | 250 | N/A | Local limit, potential Cape Fear Basin implications |
| TTO | 2.13 | 2.13 | Aligned with federal standards |
| pH | 6.0–10.0 SU | 6.0–10.0 SU | Aligned with federal standards |
Semiconductor Wastewater Characterization: Stream Segregation Strategy
Effective semiconductor wastewater pretreatment begins with strategic stream segregation, as typical fab effluent contains highly variable contaminant profiles that necessitate tailored treatment approaches. A modern 10 MGD fab, for instance, often sees its wastewater flow split into distinct streams (per IDE 2026 data), with the Chemical Mechanical Polishing (CMP) stream accounting for a significant 30–40% (3–4 MGD) of the total volume. Other major streams include high-fluoride etch (1.5–2 MGD), ammonia-bearing rinse (1–1.5 MGD), and organic/solvent/PFAS-laden streams (0.5–1 MGD), with the remaining volume being low-contaminant cooling blowdown.
Each segregated stream presents unique treatment challenges. The CMP stream, characterized by 500–2,000 mg/L of colloidal silica/alumina slurry (TSS), a pH between 4–10, and moderate COD levels of 100–300 mg/L, is typically targeted for dissolved air flotation (DAF) pretreatment. High-fluoride etch streams often contain 500–5,000 mg/L of fluoride, a low pH of 1–3, and elevated metal concentrations (e.g., Cu, Ni, Fe) ranging from 10–100 mg/L, making them ideal candidates for two-stage lime/CaCl₂ precipitation followed by lamella clarification. Ammonia-bearing rinse waters, with NH₃-N levels of 200–800 mg/L and a pH of 9–11, are typically treated via air stripping at elevated pH or breakpoint chlorination, provided the local sewer authority permits chlorine residuals. Finally, organic and PFAS-containing streams, which can have TOC levels of 200–1,000 mg/L and ∑PFAS concentrations of 1–50 µg/L from photoresists and solvents, require advanced treatment such as ultrafiltration (UF) followed by Advanced Oxidation Processes (AOPs) and granular activated carbon (GAC) polishing. For more detailed insights into treating complex organic streams, refer to our hybrid organic/PFAS treatment for chip fabs guide.
| Wastewater Stream | Typical Flow (% of Total) | Key Contaminants | Typical Concentration Range | Target Pretreatment |
|---|---|---|---|---|
| CMP Wastewater | 30–40% (3–4 MGD) | TSS (colloidal silica/alumina), COD | TSS: 500–2,000 mg/L; COD: 100–300 mg/L | DAF, Coagulation/Flocculation |
| HF Etch Wastewater | 15–20% (1.5–2 MGD) | Fluoride, Heavy Metals (Cu, Ni, Fe) | Fluoride: 500–5,000 mg/L; Metals: 10–100 mg/L | Lime/CaCl₂ Precipitation, Clarification |
| Ammonia Rinse Wastewater | 10–15% (1–1.5 MGD) | Ammonia-Nitrogen (NH₃-N) | NH₃-N: 200–800 mg/L | Air Stripping, Breakpoint Chlorination |
| Organic/PFAS Wastewater | 5–10% (0.5–1 MGD) | TOC, PFAS, Solvents, Photoresists | TOC: 200–1,000 mg/L; PFAS: 1–50 µg/L | UF + AOP (UV/H₂O₂) + GAC |
Treatment Train Design: Unit Operations Sized for Durham Limits
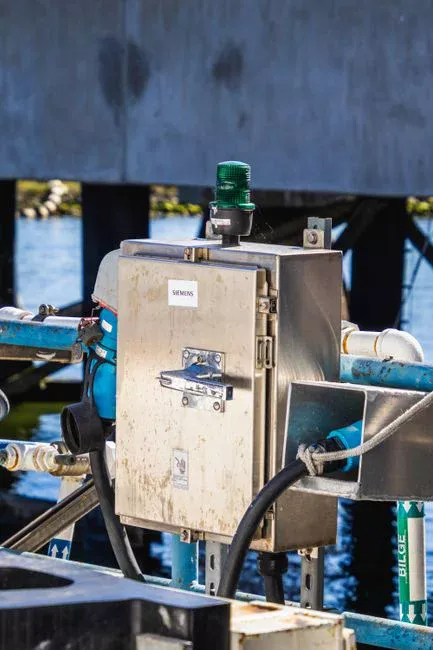
Achieving Durham's stringent discharge limits requires a multi-barrier treatment train, with each unit operation specifically designed to address target contaminants and meet specified removal efficiencies. For CMP slurry removal, a DAF for CMP slurry removal system, with a typical range of 4–300 m³/h, can effectively treat a peak CMP flow of 3,500 m³/day (approximately 970 gpm), achieving 95% TSS removal to concentrations below 50 mg/L. This process typically involves a chemical dose of 20–50 mg/L of polyaluminum chloride (PAC) as a coagulant and 2–5 mg/L of anionic polymer as a flocculant, precisely controlled by a PLC-controlled chemical dosing for pH and coagulant control system.
Fluoride precipitation, critical for meeting the 25 mg/L Durham limit, employs a two-stage lime (Ca(OH)₂) and calcium chloride (CaCl₂) process. Stage 1 involves pH elevation to 10.5 for bulk CaF₂ precipitation, aiming for fluoride concentrations below 30 mg/L, followed by a Stage 2 polish at pH 7.5. The precipitated solids are then efficiently separated using a lamella clarifier for fluoride precipitation, designed for surface loadings of 20–40 m/h, with the resulting sludge dewatered by a filter press for fluoride/metal sludge dewatering to achieve a 15–25% solids cake. For dissolved solids and TTO removal, an industrial RO system for high-recovery desalination, targeting 95% recovery, is configured in a two-stage 80:20 array. This system treats feed TDS ranging from 1,500–3,000 mg/L to produce permeate with less than 50 mg/L TDS, utilizing a semiconductor-specific antiscalant dosed at 3–5 mg/L, and requires multi-media filter as RO pretreatment to maintain a Silt Density Index (SDI) below 3.
For PFAS and organic contaminants, an Advanced Oxidation Process (AOP) utilizing a UV/H₂O₂ reactor is deployed, typically operating at an 800 mJ/cm² fluence with a 20 mg/L H₂O₂ dose. This configuration achieves greater than 90% destruction of PFOS/PFOA and over 95% reduction in TOC. An alternative, Ozone/H₂O₂, may be considered if bromide concentrations are below 0.1 mg/L to prevent bromate formation. Detailed AOP system design principles can be found in our AOP process flow diagram for PFAS destruction guide. Finally, a PLC-controlled chemical dosing for pH and coagulant control system performs final pH trim using CO₂ sparging or dilute H₂SO₄ dosing to ensure the discharge meets the SUO pH range of 6.0–10.0.
| Unit Operation | Contaminant Target | Key Design Parameter/Sizing | Target Removal/Effluent Quality |
|---|---|---|---|
| DAF | CMP TSS, Colloidal Silica | 3,500 m³/day (970 gpm) peak flow; 20–50 mg/L PAC, 2–5 mg/L Polymer | >95% TSS removal; Effluent TSS <50 mg/L |
| Fluoride Precipitation (2-stage) | Fluoride, Heavy Metals | Stage 1 pH 10.5 (Ca(OH)₂); Stage 2 pH 7.5 (CaCl₂) | Fluoride <25 mg/L; Metals <1 mg/L |
| Lamella Clarifier | Precipitated Solids | Surface Loading 20–40 m/h | Effluent TSS <30 mg/L |
| Industrial RO System | Dissolved Solids, TTO | 95% recovery; 2-stage 80:20 array; Antiscalant 3–5 mg/L | Permeate TDS <50 mg/L; TTO <0.5 mg/L |
| UV/H₂O₂ AOP | PFAS, Organics (TOC) | 800 mJ/cm² fluence; 20 mg/L H₂O₂ dose | >90% PFOS/PFOA destruction; >95% TOC reduction |
| Final pH Trim | pH Adjustment | CO₂ sparging or H₂SO₄ dosing | Discharge pH 6.0–10.0 SU |
Permitting & Compliance Workflow: From Application to Ongoing Reporting
Navigating the pretreatment permitting process for a semiconductor facility in the Durham area requires a structured approach to ensure timely approval and avoid enforcement actions. The first critical step is to submit a Baseline Monitoring Report (BMR) to the City of Durham and NC DEQ, which must include 90 days of flow-proportional composite sampling for all SUO Table 1 parameters, in addition to PFAS analysis using EPA Method 1633. This BMR is due 180 days prior to the anticipated start of discharge. Subsequently, facilities must prepare a comprehensive Pretreatment System Design Report, stamped by a North Carolina Professional Engineer (NC PE), detailing the P&ID, hydraulic profile, chemical storage secondary containment, slug control plan, and an O&M manual.
The NC DEQ 15A NCAC 02H .0200 permit application typically undergoes a 120-day review period; however, if the proposed discharge volume exceeds 100,000 gallons per day, a public notice period will extend this timeline. Permits are generally issued for a 5-year term. Post-permit issuance, ongoing compliance mandates quarterly self-monitoring reports (SMRs) submitted within 30 days of the quarter's end, an annual priority pollutant scan, and immediate 24-hour verbal notification followed by a 5-day written report for any exceedance or slug discharge event. The City of Durham conducts annual inspections and biennial compliance audits, requiring facilities to maintain all pretreatment records on-site for a minimum of three years. For a comparative perspective on regional compliance strategies, consult our Hackensack, NJ semiconductor pretreatment guide.
CAPEX/OPEX Benchmarks for Durham-Area Fab Pretreatment
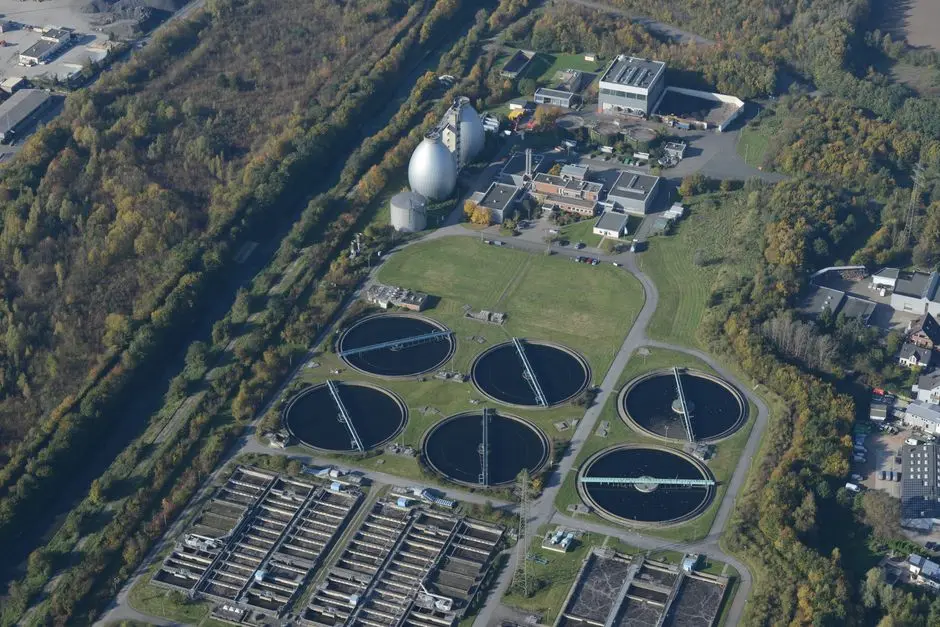
Preliminary budgeting for a semiconductor pretreatment system in the Durham area, designed to handle a 2 MGD side-stream, reveals significant capital expenditures (CAPEX) and ongoing operational expenses (OPEX). In 2026 USD, the CAPEX for such a system typically ranges from $4.2 million to $6.8 million. This includes estimated costs for a DAF system at $450K–$650K, fluoride precipitation and clarification at $600K–$900K, and an RO train (including UF pretreatment) representing $1.2M–$1.8M. Additionally, an AOP (UV/H₂O₂) system is benchmarked at $500K–$800K, chemical dosing and control systems at $300K–$500K, and instrumentation/SCADA systems at $250K–$400K. Installation and civil works typically add another 35–45% of the total equipment cost.
Annual OPEX for treating a 2 MGD side-stream is estimated at $1.80–$2.50 per kilogallon (kgal) treated (2026 USD). Chemical costs, including lime, PAC, polymer, antiscalant, H₂O₂, and acid, contribute $0.45–$0.65/kgal. Power consumption for pumps, UV, and RO high-pressure systems ranges from $0.30–$0.45/kgal. Membrane and UV lamp replacements typically add $0.25–$0.35/kgal, while sludge disposal for 15–25% solids (non-hazardous) is $0.20–$0.30/kgal. Labor costs, typically requiring 1.5 full-time equivalents (FTE), are estimated at $0.15–$0.20/kgal. A significant financial benefit is derived from water recovery; an 85% RO recovery rate reduces sewer discharge volume by approximately 6.7 times compared to no recycle. At Durham's 2025 sewer rate of $8.50/kgal, this translates to annual savings of approximately $1.1 million for a 2 MGD feed. For broader cost comparisons, explore our IC fab ZLD design and CAPEX benchmarks and ETP cost breakdowns.
| Cost Category | CAPEX (2026 USD, 2 MGD Side-Stream) | OPEX (2026 USD/kgal treated) |
|---|---|---|
| DAF System | $450K–$650K | N/A |
| Fluoride Precipitation/Clarification | $600K–$900K | N/A |
| RO Train (incl. UF pretreatment) | $1.2M–$1.8M | N/A |
| AOP (UV/H₂O₂) | $500K–$800K | N/A |
| Chemical Dosing/Controls | $300K–$500K | $0.45–$0.65 (Chemicals) |
| Instrumentation/SCADA | $250K–$400K | N/A |
| Installation/Civil | 35–45% of equipment cost | N/A |
| Power | N/A | $0.30–$0.45 |
| Membrane/UV Lamp Replacement | N/A | $0.25–$0.35 |
| Sludge Disposal | N/A | $0.20–$0.30 |
| Labor (1.5 FTE) | N/A | $0.15–$0.20 |
| Total Range | $4.2M–$6.8M | $1.80–$2.50 |
Frequently Asked Questions
What is the fluoride limit for semiconductor discharge to Durham sewer?
The fluoride discharge limit for semiconductor facilities to the City of Durham's sanitary sewer is 25 mg/L, as stipulated by City of Durham SUO Sec. 70-121 (2024 revision). This local limit is more stringent than the federal 40 CFR 469 guideline of 32 mg/L, requiring robust fluoride precipitation in pretreatment.
Can I use biological treatment for semiconductor wastewater?
Biological treatment is generally suitable only for segregated low-toxicity streams, such as cooling blowdown or specific rinse waters, within a semiconductor facility. While an MBR Membrane Bioreactor can achieve COD levels below 50 mg/L, it is ineffective for high concentrations of fluoride, heavy metals, or PFAS found in other fab waste streams, which require physicochemical or advanced oxidation processes.
Does NC DEQ require PFAS monitoring for semiconductor pretreatment permits?
Yes, per the EPA's 2024 PFAS Strategic Roadmap and NC DEQ's 2025 guidance, semiconductor pretreatment permits now typically require quarterly ∑PFAS monitoring using EPA Method 1633. Facilities must also submit and adhere to a Best Management Practices (BMP) plan specifically addressing PFAS generation and control.
What RO recovery is achievable with semiconductor wastewater?
High-recovery RO systems, often two-stage with specialized semiconductor antiscalants, can achieve 85–90% water recovery from semiconductor wastewater. While Zero Liquid Discharge (ZLD) systems incorporating brine concentrators and crystallizers can push recovery beyond 95%, they generally double the operational expenses due to increased energy and maintenance requirements.
How long does NC DEQ pretreatment permit approval take?
The NC DEQ pretreatment permit approval process typically takes 120 days for a complete application. However, if the proposed discharge volume exceeds 100,000 gallons per day, an additional 60-day public notice period is required, extending the overall approval timeline.