What the Decanter Centrifuge Process Flow Diagram Actually Shows
A decanter centrifuge is a continuous solid-bowl centrifuge — one feed stream in, two product streams out. Slurry enters the horizontal rotating bowl; under 1,000–4,000 × g, denser solids migrate to the bowl wall, the screw scroll (a helical conveyor running inside the bowl) conveys the cake up the conical beach at a small differential speed (the gap between bowl and scroll rotation rates), clarified liquid exits over a weir plate or through a paring disc at the large end, and dewatered solids discharge at the small end of the cone (Wikipedia, 2026). The decanter centrifuge process flow diagram is, in practice, the engineering drawing that ties those streams to the upstream and downstream unit operations: feed tank, sludge pump, polymer dosing skid, feed pipe, the cylindrical clarification zone, the beach, the cake chute, and the centrate launder. A 3-phase tricanter variant adds a third outlet so that two immiscible liquids (typically oil and water) leave separately from the solids (Wikipedia, 2026).
Modern industrial decanters handle up to 250 m³/h of liquid feed and reach 18,000 kg/hr of dry solids on the largest units; vendor portfolios stretch from 0.1 m³/h pilot machines to 500 m³/h utility-scale units (Wikipedia, 2026; ANDRITZ D-series datasheet, 2026). The flow diagram must always be sized to a specific model — the geometry, the bowl speed, and the L/D ratio (length-to-diameter ratio of the cylindrical section) drive every downstream number, and a generic block diagram hides the engineering reality.
Conceptually, the flow reduces to a single line:
Feed Tank → Feed Pump → Polymer Dosing → Feed Pipe → Decanter Bowl (Cylindrical Clarification Zone + Conical Beach) → {Centrate, Cake}
For a tricanter, the right-hand side becomes {Light Liquid, Heavy Liquid, Cake}. Every parameter discussed in the rest of this article attaches to one of those blocks.
Stage 1: Feed Preparation and Polymer Conditioning
The decanter only performs as well as the feed it sees. A feed/buffer tank equalises swings in solids concentration and viscosity — without that buffer, the G-force and differential-speed numbers on the datasheet stop being meaningful (Wikipedia, 2026). From the buffer, a progressing-cavity pump or centrifugal feed pump moves the slurry at a controlled rate; flow here sets residence time in the bowl, and residence time sets capture.
Polymer or flocculant is dosed inline just upstream of the bowl to agglomerate fine particles into pin flocs (small, compact floc structures) that the centrifuge can actually capture. Per the ANDRITZ D-series datasheet (2026), the conditioning chemistry — polymer type and dose — directly sets achievable dryness and capture rate, and the ANDRITZ DU generation uses about 1 kg/TDS (kilogram of polymer per tonne of dry solids) less than a conventional decanter, a benchmark worth quoting into a design basis. The same source confirms that the D-series still runs without polymer on many sludges, but that is the exception, not the rule, and dosing should appear on the PFD for any new design. An automatic polymer dosing skid for sludge conditioning is the standard way to make that step controllable and auditable.
Two rules of thumb to put on the diagram: keep the feed pipework short and straight to avoid floc shear, and meter both flow and polymer dose to a single trend so the operator can see cause and effect during upsets. Wide variation in feed solids is the single most common reason a decanter "isn't working" — the bowl geometry has not changed, but the feed has.
Stage 2: Feed Pipe, Infeed Chamber and Acceleration Zone
Slurry enters through an axial feed pipe into the infeed chamber at the centre of the scroll hub, where it is accelerated to bowl speed before reaching the pool (the annular layer of liquid held against the bowl wall by centrifugal force) (Wikipedia, 2026). This transition is the one most process diagrams draw as a static arrow, but it is doing real work: any turbulence or sharp bend in the feed pipe shears the pin flocs the polymer skid just built, and re-suspended fines end up in the centrate.
The ANDRITZ TurboWISETM polyurethane-lined feed chamber is a useful benchmark here: the CFD-optimised (computational fluid dynamics–optimised) liner accelerates the slurry efficiently, reduces flocculant demand, and is field-replaceable, which is the kind of feature an engineer can specify when the feed line is long or the polymer budget is tight (ANDRITZ D-series datasheet, 2026). As a rule, the feed line should be as short and straight as the layout allows, with no elbows in the last 5–10 bowl diameters.
Throughput at this stage is the throttle on every downstream number. High flow means less residence time in the clarification zone, lower solids capture, and a wetter cake. The volumetric flow rate is therefore the primary control variable the operator tunes first; G-force, differential speed, and pool depth are set around it.
Stage 3: Cylindrical Clarification Zone — Where Centrifugal Force Does the Work
The slurry reaches maximum bowl speed in the cylindrical section of the bowl. Under 1,000–4,000 × g, denser solids migrate outward to the bowl wall while clarified liquid moves inward toward the axis — this is the actual separation step (Wikipedia, 2026). The cylindrical section is also where the bowl's L/D ratio lives, and ratios of 2, 3, and 4 are standard: at the same diameter, a longer bowl conveys more solids, holds a larger suspension volume, and gives finer particles a better chance to settle (Wikipedia, 2026). A useful rule is that the first 25% of the bowl length captures the coarsest particles; the remaining length polishes the centrate (Minerals 11(2):229, 2021).
Pool depth — the radial thickness of the liquid layer held against the bowl wall — is set by adjustable weir plates or weir discs at the centrate end. Deeper pool means more buffer liquid for fine-particle capture, but lower effective G on the cake and lower centrate clarity at the same G-force (Wikipedia, 2026). Shallow pool maximises G on the liquid and improves centrate clarity, but if the cake layer is too thick, fines get re-entrained into the fast liquid stream. The optimum is application-specific and is normally identified by test work.
Sedimentation rate in this zone is governed by four engineering knobs the designer can change: particle size, particle shape, solid–liquid density difference, and liquid viscosity. Polymer conditioning, feed pre-heating, and dilution are the usual levers. The Σ-theory (sigma-theory) scale-up, originally introduced by Ambler, ties bowl geometry and G-force to equivalent settling area, but the Minerals 2021 numerical work shows the Σ-theory under-predicts industrial-scale behaviour once the screw-induced shear on the sediment is included — so the table values that follow should be treated as starting points, not gospel.
Stage 4: Scroll, Differential Speed and Cake Transport
An internal screw scroll rotates at a slightly different speed from the bowl. The difference — the differential speed — is set by a gear unit and is the main control for cake transport along the bowl (Wikipedia, 2026). Both the bowl and the scroll turn at high speed (typically 2,000–4,000 rpm on industrial units); only the difference between their speeds is small, and that difference is what moves the cake.
The trade-off is direct. Higher differential speed gives higher solids throughput but shorter cake residence time on the beach and a wetter cake; lower differential speed gives a drier cake and better centrate clarity, at the cost of throughput (Wikipedia, 2026). Differential speed is therefore the single most important operating parameter on the entire flow diagram — every other variable is geometry.
On modern units the scroll is driven through a regenerative back drive that recovers the scroll's braking energy and feeds it back to the main motor, an OPEX (operating expenditure) win on the same machine (ANDRITZ D-series datasheet, 2026). The D-series direct-drive option avoids the recirculation losses of a hydraulic back drive and cuts another ~5% of total power. For P&ID (piping and instrumentation diagram) purposes, the differential-speed setpoint and the back-drive power return should both appear as controlled variables, not just monitored ones.
Stage 5: Conical Beach, Cake Dewatering and Solids Discharge
The settled cake leaves the pool and is conveyed up the conical section — the beach — out of the liquid, where it dewaters further before discharge (Wikipedia, 2026). At the smallest end of the cone, dewatered solids leave the bowl through a discharge opening into a chute or conveyor for downstream handling. Cake from this point commonly feeds a plate and frame filter press for downstream cake handling when higher dryness is required for transport or disposal.
Beach angle is a design parameter, not an operating one, and it deserves a line on the PFD. A smaller cone angle lowers the slippage force on the solids, reduces scroll wear, and suits soft or hard-to-compact cakes; a larger angle favours compact, easy-to-convey cakes (Wikipedia, 2026). Typical industrial beach angles sit between 8° and 15°, with low-angle designs chosen for soft biological sludges and steeper angles for mineral and crystalline feeds.
The beach is also where the main centrifuge trade-off lives: the same G-force that helps dewatering on the wet end of the beach hinders cake conveyance on the dry end. The engineer balances G-force, pool depth, and differential speed so that the cake exits the cone with the dryness the downstream process needs and the centrate carries less than the contractually specified TSS (total suspended solids) — a balance that is always tuned on the actual sludge in pilot work.
Stage 6: Centrate Discharge and 3-Phase (Tricanter) Variants
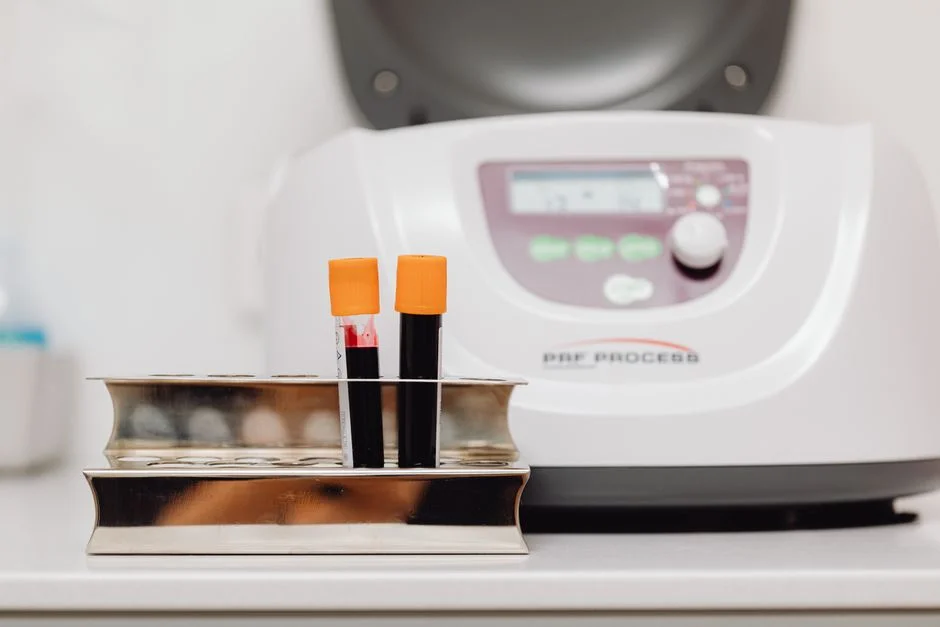
Clarified liquid flows toward the cylindrical end of the bowl and exits through openings controlled by adjustable weir plates or through a paring disc — an internal centripetal pump that scoops liquid out at bowl pressure without letting it slow down (Wikipedia, 2026). For readers laying out a CASS process flow diagram engineering guide downstream, the centrate from the decanter is often the feed to a polishing stage; the weir setting on the decanter is what determines how much load that polishing stage has to absorb.
In a 3-phase tricanter, two immiscible liquids plus solids are separated in one pass. The light liquid (typically oil) discharges over a ring dam by gravity; the heavy liquid (typically water) is pulled out by a stationary impeller under pressure; the solids ride the scroll to the cake outlet (Wikipedia, 2026). Typical applications include olive oil, oil-sludge processing, and biodiesel production — all food and oil-and-gas adjacent. The largest units in this class, such as the Z8E, deliver 24,000 N·m of torque and handle up to 250 m³/h; the ANDRITZ portfolio spans 0.1–500 m³/h, so the flow diagram should always carry a model number, not a generic block (Wikipedia, 2026; ANDRITZ D-series datasheet, 2026).
For plants comparing a decanter against a dissolved-air-flotation pre-thickener, the relevant cross-reference is the upstream DAF system PFD — the DAF system process flow diagram walkthrough describes the thickening stage that typically feeds the decanter in municipal and food plants.
Decanter Centrifuge Parameter Table (Engineering Reference)
The table below consolidates the operating window behind every stage of the flow. Values are drawn from Wikipedia (2026) and the ANDRITZ D-series datasheet (2026); "geometry" means the parameter is set at build, "operating" means it is tuned during running.
| Parameter | Typical Range | Set By | Engineering Effect |
|---|---|---|---|
| G-force (bowl wall) | 1,000–4,000 × g | Bowl radius × rpm² | Higher G → better centrate clarity and drier cake, but harder cake conveyance on beach |
| Bowl speed | ~2,000–4,000 rpm | Operating (drive setpoint) | Sets G-force via bowl radius |
| Differential speed (scroll vs bowl) | ~5–50 rpm | Operating (gear unit / back drive) | Higher → higher solids throughput, wetter cake; lower → drier cake, better clarity |
| L/D ratio (cylindrical zone) | 2 / 3 / 4 | Geometry | Longer bowl at same diameter → higher solids capacity and better fine capture |
| Beach angle | 8–15° (typical) | Geometry | Smaller angle → lower slippage, suits soft cakes; larger angle suits compact cakes |
| Pool depth (pond depth) | Set by weir plate / paring disc | Operating | Deeper → better fine capture, lower effective G; shallow → better clarity |
| Feed solids range | ~0.5–10% w/w (typical thickening/dewatering) | Upstream | Drives polymer demand and achievable capture |
| Liquid throughput | 0.1–500 m³/h (vendor portfolio) | Operating | Sets residence time in the bowl |
| Dry solids capacity | Up to 18,000 kg/hr (largest units) | Geometry + operating | Linked to L/D, G-force, and differential speed |
| Specific energy | Reduced ~15–30% with HHP/TurboJet features | Geometry + operating | Lower with regenerative back drive, HHP rotating assembly, TurboJet weir plates |
Frequently Asked Questions
What is a decanter centrifuge process flow diagram?
A decanter centrifuge process flow diagram is the engineering drawing that traces slurry from the feed tank, through a feed pump and polymer dosing skid, into the rotating horizontal bowl where 1,000–4,000 × g separates solids to the bowl wall, then out as centrate (clarified liquid) over a weir plate or paring disc and as dewatered cake through the small end of the conical beach. In a 3-phase tricanter configuration a second liquid phase (e.g., oil or water) exits separately (Wikipedia, 2026).
What G-force does a decanter centrifuge generate?
Industrial decanter centrifuges generate 1,000–4,000 × g at the bowl wall, set by bowl radius and rotational speed. Higher G improves centrate clarity and cake dryness, but also increases the force the scroll has to overcome on the dry beach, so the engineer balances it against cake conveyance (Wikipedia, 2026).
What controls centrate clarity vs cake dryness?
Differential speed, pool depth, G-force, and beach angle together set the trade-off. Lower differential speed, shallower pool, and higher G all push toward cleaner centrate and a drier cake, at the cost of throughput; higher differential speed and deeper pool push the other way. The optimum is identified by test work on the actual feed (Wikipedia, 2026).
What is the difference between a 2-phase decanter and a 3-phase tricanter?
A 2-phase decanter separates slurry into two streams — clarified liquid and dewatered solids — in one pass. A 3-phase tricanter separates three streams — two immiscible liquids (e.g., oil and water) plus solids — in one pass, with the light liquid discharging over a ring dam and the heavy liquid pulled out by a stationary impeller (Wikipedia, 2026).
How much can a horizontal decanter centrifuge handle?
The largest industrial units handle up to 18,000 kg/hr of dry solids and 250 m³/h of liquid feed. The ANDRITZ decanter portfolio spans 0.1–500 m³/h per machine, so the flow diagram should always be tagged to a specific model rather than drawn generically (Wikipedia, 2026; ANDRITZ D-series datasheet, 2026).