
What 'Good DAF Operation' Actually Looks Like in 2026
A DAF plant operation and maintenance guide in 2026 centers on four KPI families: hydraulic loading rate, air-to-solids ratio, float solids concentration, and effluent TSS — which together explain more than 90% of performance drift on a well-run unit. Treat saturator pressure above 500 kPa and recycle ratios above 7% as cost without benefit, and run daily, weekly, monthly, and quarterly checklists anchored to those KPIs (per Vlaški, CRC Press, 1998).
The four KPI families are: hydraulic loading rate (typically 5–25 m/h on industrial units), air-to-solids ratio or A/S (0.005–0.060 by mass, with 0.01–0.04 the practical operating band), float solids concentration (3–6% TS as a stable target), and effluent TSS (under 30 mg/L for most industrial pre-treatment duty). When an operator logs those four numbers every shift, performance drift stops being a feeling and becomes a number on a trend chart.
The realistic removal ceiling is 75–85% for fine suspended solids and phosphorus on a properly tuned industrial DAF (per waterandwastewater.com, 2024). Anyone quoting 95%+ steady-state on a variable industrial feed is selling, not engineering. The kinetic ceiling — the particle-bubble collision efficiency coefficient αPb = 0.5 — is the theoretical optimum a well-run DAF approaches under controlled chemistry (Vlaški, CRC Press). For unit benchmarking, the dissolved air flotation system spans 4–300 m³/h across 13 models, which gives a reference duty point when you are comparing hydraulic loading across units.
DAF Mechanism Refresher — Only the Parts That Change Setpoints
The DAF chain is pressure-saturation → pressure-reduction → microbubble-floc attachment → float rise → skim. The operator only needs to control four variables: saturator pressure, recycle ratio, polymer/coagulant dose, and hydraulic retention time in the contact zone. Everything else is upstream chemistry or downstream mechanical handling.
Saturator pressure above 500 kPa and recycle above 7% deliver no measurable gain in bubble density or removal efficiency according to Vlaški's kinetic modelling work (CRC Press, 1998). The model was more sensitive to particle size than bubble size, so chasing higher pressure is a kWh bill with no removal upside. The same source flags coagulation pH, temperature, and organic-matter concentration as the upstream levers that actually move αPb — meaning the fastest way to a better float is usually a jar test, not a setpoint change on the saturator.
Hydraulic retention time in the contact zone (typically 60–120 seconds at design flow) is the fourth controllable variable. Cranking hydraulic loading above the design rate shortens contact time, drops A/S, and produces the watery float that operators instinctively recognize as a problem. Treat the contact zone as a reactor with a defined volume, not a pipe with flow through it.
Daily, Weekly, Monthly and Quarterly Maintenance Checklist
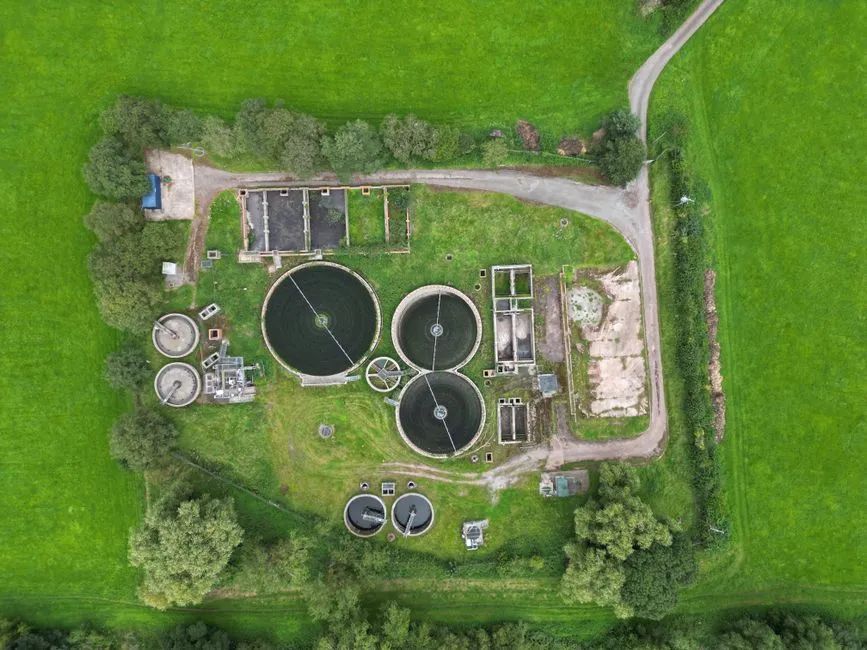
The single most valuable asset for a shift team is a layered runbook they can execute without phoning a process engineer. The four tiers below assume a standard partial-flow DAF with recycle, a polymer feed system, and a mechanical skimmer.
| Frequency | Task | Pass/Fail Trigger |
|---|---|---|
| Daily | Log inlet flow, saturator pressure, recycle flow, polymer dose, effluent TSS, float depth, skimmer runtime | Drift >10% versus previous shift on any logged value |
| Daily | Visual check of float color, thickness, and skim completeness | Float <50 mm or visibly watery |
| Weekly | Inspect and clean pressure-relief valve and nozzle assembly | Visible scaling, pressure drop >20 kPa at constant flow |
| Weekly | Check recycle pump seal, air compressor receiver pressure, float %TS | Receiver < setpoint −10%; float %TS outside 3–6% |
| Monthly | Inspect skimmer blade wear, contact-zone baffles, level sensors | Blade wear >3 mm; sensor drift >5% of range |
| Monthly | Pull a corrosion coupon (stainless units); verify polymer feed calibration | Coupon loss >1 mpy; calibration >5% off setpoint |
| Quarterly | Full pump and valve service, aeration system inspection, control-loop tuning | Any service item past manufacturer interval |
| Quarterly | Written KPI trend review with corrective-action memo | Any KPI outside alarm threshold for 3+ days in the quarter |
The daily log feeds the quarterly review. Skipping the log means the quarterly review is just a meeting, not a diagnosis.
Operating Parameter Targets: The One Table Every DAF Plant Should Pin to the Wall
Pin this to the control room wall, as every row is a defensible range with a named source. Anything outside the alarm column is a setpoint the operator should be able to defend in writing.
| Parameter | Typical Industrial Range | Alarm Threshold | Action If Breached | Data Source |
|---|---|---|---|---|
| Saturator pressure | 400–500 kPa | >550 kPa or <350 kPa | Reduce compressor output or check for nozzle blockage | Vlaški, CRC Press |
| Recycle ratio | 5–7% | >10% | Reduce recycle pump speed; verify contact-zone flow | Vlaški, CRC Press |
| Hydraulic loading rate | 5–25 m/h | > design rating | Throttle inlet or shed upstream load | Industrial design standard |
| Float depth | 50–150 mm | <30 mm or >200 mm | Adjust skimmer cycle; audit upstream load | Operator field practice |
| Float %TS | 3–6% | <2% or >7% | Re-run jar test; check polymer dose | Industrial design standard |
| Air-to-solids ratio (A/S) | 0.01–0.04 by mass | <0.005 | Increase recycle or reduce solids loading | Engineering reference |
| Effluent TSS | <30 mg/L (pre-treatment duty) | >50 mg/L | Stop and run jar test; check coagulation pH | waterandwastewater.com |
| TSS removal efficiency | 75–85% | <70% sustained | Full KPI review; check coag/floc G·t | waterandwastewater.com |
These targets are a starting point, not a guarantee. Re-tune after any chemistry change — new influent source, new polymer, new coagulant — by running a fresh jar test on the current feed.
Troubleshooting Flow: From Symptom to Root Cause in Five Questions
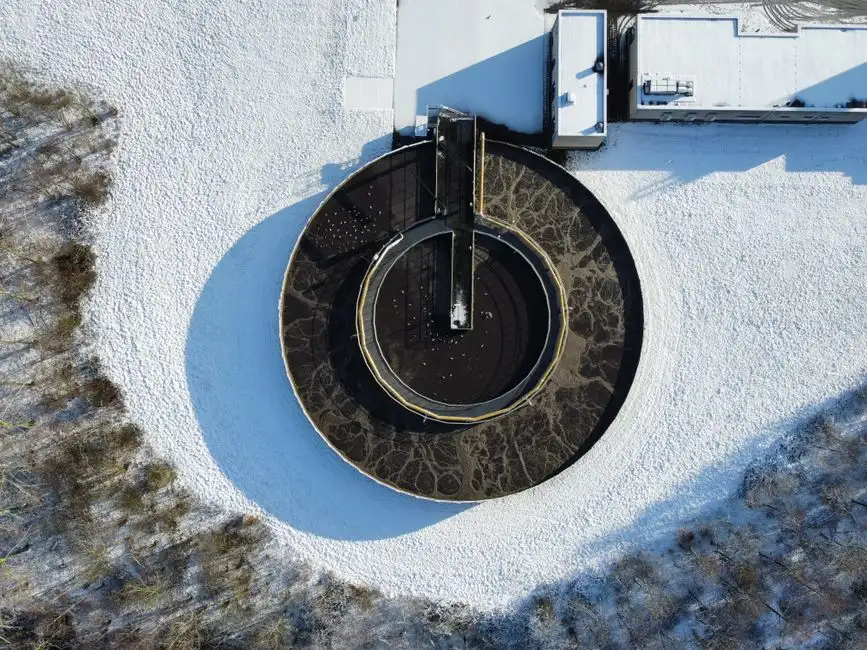
A new shift hand should reach the same conclusion an experienced tech does. The table below turns the five most common DAF symptoms into a repeatable diagnostic path. Vlaški's work is explicit that coagulation/flocculation is the most critical factor for DAF overall efficiency — so when in doubt, the answer is upstream, not on the DAF setpoint.
| Symptom | First Check | Second Check | Likely Root Cause |
|---|---|---|---|
| Thin, watery float | A/S ratio and saturator pressure | Upstream coagulation pH and dose | Bubble starvation or poor floc formation |
| Effluent TSS creeping up, float looks normal | Polymer dose and flocculation G·t | Influent solids loading change | Coagulation chemistry drift (Vlaški, CRC Press) |
| Milky effluent | Recycle ratio >10% | Air relief valve condition | Microbubble carry-down from over-saturated recycle |
| Pump cavitation or pressure oscillation | Recycle pump NPSH | Strainer condition and air-into-water saturation | Air binding or blocked suction screen |
| Float solids >6% causing skimmer overload | Hydraulic loading rate | Skimmer cycle and upstream load | Under-loaded unit or polymer overdose |
For a side-by-side on DAF versus gravity clarifiers in high-solids duty — useful when troubleshooting points to a fundamental unit-choice mismatch — see this DAF vs clarifier comparison for mining wastewater.
Cost Control: Energy, Polymer, and Sludge in One Page
Most of the energy on a DAF plant sits in the recycle pump and the air compressor. Pushing saturator pressure past 500 kPa burns kWh with no removal benefit per Vlaški's kinetic modelling (CRC Press, 1998), so the cheapest kWh you save all year is the one you don't spend at 600 kPa. Benchmark your specific energy on a kWh per m³ of treated flow basis — a typical industrial DAF runs 0.05–0.15 kWh/m³ when tuned, and 30–50% above that when it isn't.
Polymer dose should be re-validated by jar test at least quarterly, and any time the influent source changes. A proper jar test on current feed routinely turns up 10–20% polymer savings versus a dose that was set 18 months ago and never revisited. Pair the dose pump with an automatic chemical dosing system tied to flow — the cost is recovered in polymer savings within months on any unit above 20 m³/h.
Sludge economics favor a float at 4–6% TS. Wetter float means higher hauling cost per dry ton; drier float usually means polymer overdose or hydraulic overload. The float itself is nutrient-rich and, where regulations allow, can be land-applied or sold as a soil amendment, partially offsetting O&M cost (per waterandwastewater.com). Dewater the float further with a plate and frame filter press when hauling distance or disposal cost makes the extra dryness worthwhile.
Frequently Asked Questions
What is a realistic DAF removal efficiency for industrial wastewater?
75–85% for fine suspended solids and phosphorus is the defensible operating band for a properly tuned industrial DAF, per waterandwastewater.com. Anything above that on a variable industrial feed should be treated as a marketing claim, not a steady-state target.
Why is pushing saturator pressure above 500 kPa wasted energy?
Vlaški's kinetic modelling (CRC Press, 1998) shows no measurable gain in bubble density or removal efficiency above 500 kPa saturator pressure or above 7% recycle ratio. The energy spent above those ceilings produces zero removal benefit.
How often should polymer dose be re-validated?
Run a jar test on current influent quarterly, and any time the feed source, coagulant, or polymer product changes. A fresh jar test routinely identifies 10–20% polymer savings versus a dose that has been left at the same setpoint for a year or more.
What does a thin, watery float usually mean?
Check A/S ratio and saturator pressure first. If both are in range, the problem is upstream coagulation chemistry — pH, dose, or flocculation G·t — not the DAF setpoints, per Vlaški (CRC Press).