
Why the Strictest Rule Governs at a North Billerica Fab
Three overlapping rules govern every discharge from a 200 mm or 300 mm semiconductor fab near North Billerica, MA: the EPA Industrial Pretreatment Program at 40 CFR Part 403, the semiconductor categorical effluent standard at 40 CFR Part 413, and the local Massachusetts POTW Sewer Use Ordinance. The strictest of the three is the binding design number, and in the Lowell–North Billerica–Route 3 corridor the SUO almost always wins. 40 CFR Part 413's daily-maximum fluoride ceiling for many subcategories sits at roughly 32 mg/L, while a typical Greater Lawrence or Billerica-area SUO caps fluoride near 15 mg/L and Cu near 1 mg/L. Engineers who size the precipitation stage to the federal categorical floor, not the local limit, will fail the first POTW inspection. A 2023 openRxiv analysis of U.S. sewer connectivity (DOI 10.1101/2023.05.24.23290486) documented the structural reason: downstream POTW capacity is highly uneven across the country, which is why control authorities write tight local limits rather than rely on the federal floor. Under 40 CFR 403.5(c), EPA evaluates each SUO for pass-through, interference, and sludge-management protection, and the ordinance can carry numeric or narrative BMP language. Looking forward, the 2026 PFAS survey from the Semiconductor Industry Consortium signals that even compliant plants should expect new analyte requests in the next permit cycle. For a side-by-side look at how plastics and rubber pretreatment is structured against the same 40 CFR Part 403 framework, see this plastics and rubber pretreatment comparison.
| Layer | Rule | Typical F⁻ limit | Typical Cu limit | Mechanism |
|---|---|---|---|---|
| 1 | 40 CFR Part 403 IPP | Not numeric | Not numeric | Pass-through / interference definitions, 5-year permit |
| 2 | 40 CFR Part 413 categorical | ~32 mg/L daily max | 1–3 mg/L individual; 5 mg/L combined | Subcategory ceilings for semiconductor fabs |
| 3 | Local MA POTW SUO (binds) | ~15 mg/L | ~1 mg/L | Numeric or narrative; enforces pass-through and interference |
Segregating the Four Waste Headers at Piping Design Time
Floor-drain segregation is the single highest-ROI piping decision on a 300 mm fab, and it is locked in at design time, not retrofitted after startup. Stream 1 is the fluoride header from HF, buffered HF (BHF), and NH₄F wet-etch and post-etch cleaning: 50–500 mg/L F⁻ at pH 1–3, with periodic spikes above 1,000 mg/L during tool-dump cycles. Stream 2 is the TMAH/developer header from 2.38% tetramethylammonium hydroxide photoresist developer: 100–500 mg/L TMAH-N at pH 12–14, carrying 2,000–8,000 mg/L COD from dissolved resist. Stream 3 is the acid/CMP header from H₂SO₄/H₂O₂ and HNO₃ rinses combined with spent Cu, Ni, and colloidal-silica slurry overflow: pH 1–3, 5–50 mg/L Cu, 0.5–5 mg/L Ni, 200–1,000 mg/L TSS. Stream 4 is the resist/solvent header carrying IPA, NMP, acetone, and spent photoresist: 5,000–30,000 mg/L COD with BOD₅/COD below 0.2, meaning the stream is poorly biodegradable without Fenton or ozone pre-oxidation. The pH-incompatibility rule is the reason segregation is non-negotiable: CaF₂ forms cleanly at pH 6–8, metal hydroxides at pH 9–10.5, and TMAH biodegradation is fastest outside the fluoride window. A single cross-connected floor drain can swing a 15 mg/L fluoride effluent to 80 mg/L within an hour, which is the top 2025–2026 audit failure mode in 40 CFR 403 inspections (HydropureWater field data, 2025–2026). Specify a rotary mechanical bar screen upstream of the dosing skid as low-cost protection for metering pumps and DAF recycle from particulates, hair, and lint that ride utility-floor drains.
| Header | Source | Key parameter | Typical range | pH |
|---|---|---|---|---|
| 1 — Fluoride | HF, BHF, NH₄F etch and cleaning | F⁻ | 50–500 mg/L (spikes >1,000 mg/L) | 1–3 |
| 2 — TMAH / developer | 2.38% TMAH photoresist developer | TMAH-N; COD | 100–500 mg/L N; 2,000–8,000 mg/L COD | 12–14 |
| 3 — Acid / CMP | H₂SO₄/H₂O₂, HNO₃, Cu/Ni slurry | Cu, Ni, TSS | 5–50 mg/L Cu; 0.5–5 mg/L Ni; 200–1,000 mg/L TSS | 1–3 |
| 4 — Resist / solvent | IPA, NMP, acetone, photoresist | COD; BOD₅/COD | 5,000–30,000 mg/L COD; <0.2 ratio | Variable |
The Four-Stage Treatment Train and Where Each Stage Lands on the Permit
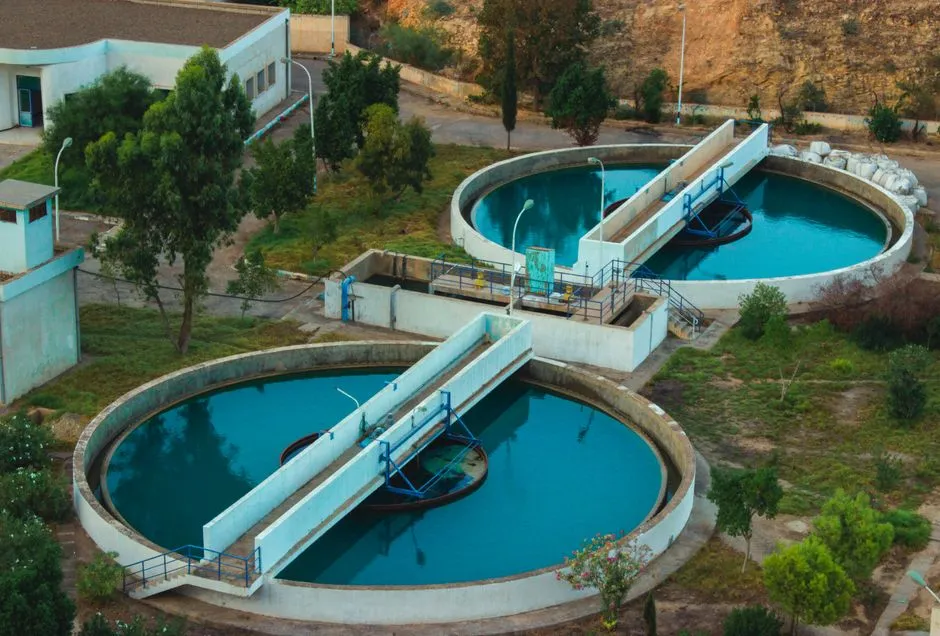
Stage 1 is source segregation and equalization: dedicated FRP or PVC-lined EQ tanks sized at 4–8 h HRT with low-shear PBT impellers to avoid emulsifying resist carryover, and online pH, conductivity, and F⁻ analyzers per tank feeding the PLC. Stage 2 is pH neutralization and chemical precipitation — the heart of the train. A PLC-controlled automatic chemical dosing skid doses CaCl₂ or lime into the fluoride stream at pH 6–8 with a Ca²⁺:F⁻ molar ratio of roughly 2.5:1 to form CaF₂ (Ksp ≈ 1.5×10⁻¹⁰), then NaOH or lime into the metal stream at pH 9–10.5 to drive Cu(OH)₂ and Ni(OH)₂. Specify a 10:1 turndown on the metering pumps, with 4–20 mA flow-pacing and pH/ISE feedback holding the dose within ±5% of setpoint. Stage 3 is solids/liquid separation. A dissolved air flotation system handles 4–300 m³/h at 4–25 m/h hydraulic loading and is the right answer for fluoride-rich or oily streams including colloidal silica from CMP; a high-rate lamella clarifier at 20–40 m/h surface loading wins where footprint is tight and solids are denser. Both devices deliver overflow TSS in the 30–60 mg/L band when upstream chemistry is correct. Stage 4 is polishing: ion exchange at ≤50 m³/h for trace metals and hardness, or an industrial RO polishing system at 75–95% recovery for fabs with a documented ≥50% reuse target. The permeate is reused as non-critical rinse, cooling-tower makeup, or scrubber feed. For chromium-bearing streams from third-generation work, insert a Cr(VI) reduction and precipitation reactor upstream of Stage 4 so chromium does not ride the Cu/Ni hydroxide line.
| Stage | Function | Design basis | Control window | Equipment |
|---|---|---|---|---|
| 1 — Equalization | Buffer tool-dump spikes | 4–8 h HRT; peak mass load (kg/d) | Online pH / F⁻ / conductivity | FRP EQ tanks, PBT impellers |
| 2 — Neutralization & precipitation | Form CaF₂, Cu(OH)₂, Ni(OH)₂ | Ca²⁺:F⁻ ≈ 2.5:1; ±5% dose control | pH 6–8 (F⁻); pH 9–10.5 (metals) | PLC-controlled automatic chemical dosing skid, CaCl₂ + NaOH |
| 3 — Solids separation | Remove precipitated sludge | 4–300 m³/h (DAF) or 20–40 m/h (lamella) | Overflow TSS 30–60 mg/L | DAF or high-rate lamella clarifier |
| 4 — Polishing | Trace metals; reuse | Single-digit µg/L metals; 75–95% RO recovery | Permeate conductivity; hardness | Ion exchange or industrial RO polishing system |
| Cr(VI) reduction | Hexavalent chromium to trivalent | Insert upstream of Stage 4 | ORP and pH monitoring | Reduction + precipitation reactor |
Side-Stream TMAH Treatment: Why the POTW Should Never See a Raw Slug
TMAH-N above 10 mg/L in mixed liquor will crash a Suffolk, Nassau, or Greater Lawrence biological plant for days, so on-site biological treatment is non-negotiable for the developer header. Specify a side-stream MBR at 1.0–1.5 kg COD/m³·day with 12–24 h HRT, and use an MBR membrane bioreactor module rated for the long solids-retention-time operation that retains slow-growing TMAH-degraders such as Hydrogenophaga and Methylophilus spp. Without the long SRT, the population washes out and effluent quality drifts. After the MBR, run a conventional nitrification–denitrification stage and target effluent NH₃-N below 30 mg/L; otherwise the receiving POTW will flag the discharge on the next DMR review. The decision rule for stream merging is sharper than most EPCs treat it. CMP metals can be sent to the POTW only if the receiving utility guarantees <1 mg/L Cu and <0.5 mg/L Ni in writing, verified line by line in the SUO before any pipe is sized for that path. Resist and solvent streams can be merged only if the POTW has Fenton or ozone AOP capacity; otherwise pre-oxidize on-site to lift BOD₅/COD above 0.3 before discharge.
Sizing DAF vs Lamella, Plus the Sludge Train That Closes the Mass Balance
DAF at 4–300 m³/h wins on fluoride-rich or oily streams, including colloidal silica from CMP, where float loading is high. Lamella at 20–40 m/h surface loading wins on footprint and denser solids, and energy tradeoffs should be evaluated per site. Sludge exits Stage 3 at 1–4% dry solids and is dewatered on a plate-and-frame filter press sized from 1 m² on a pilot skid to 500 m² on a full-fab multi-press line, producing a 25–35% dry-solids cake for off-site hazardous-waste disposal. Filtrate returns to the head of the train, which is why the solids handling train is sized on the same peak-mass-load basis as the chemical stage: a tool-dump fluoride spike also spikes that day's sludge mass. The 50,000 m³/yr breakpoint is the right rule of thumb. Below it, an integrated coagulation–sedimentation–filtration skid with a small MBR usually beats a pipe-rack to a central POTW and pays back in 3–5 years. Above 100,000 m³/yr, the 2026 trend is to install dedicated on-site pretreatment for fluoride and TMAH only, then merge with general fab effluent for the park's central biological stage (HydropureWater field data, 2026).
| Decision | DAF | Lamella | Basis |
|---|---|---|---|
| Flow range | 4–300 m³/h | 20–40 m/h surface loading | Peak mass load (kg/d), not average flow |
| Best fit | Fluoride-rich, oily, colloidal silica | Tight footprint, denser solids | Site-specific float vs settle loading |
| Overflow TSS | 30–60 mg/L | 30–60 mg/L | Upstream chemistry must be correct |
| Sludge | 1–4% dry solids to plate-and-frame filter press | 1–4% dry solids to plate-and-frame filter press | 25–35% dry-solids cake for off-site disposal |
Monitoring, OPEX, and the Three Audit Failures That Keep Showing Up
The minimum online monitoring package for an IPP-regulated fab in the Greater Lawrence or Billerica sewer system is a pH probe and a fluoride ISE on the combined effluent header, an on-line ICP-OES or XRF-on-line unit for Cu, Ni, Cr, and any metal the SUO lists, plus continuous flow. The dosing skid should be tied to pH and F⁻ ISE feedback so an excursion triggers an automatic dose trim rather than a phone call to the shift supervisor. Permit obligations include a 5-year IPP cycle, monthly DMRs, an annual baseline POTW inspection (more frequent for Significant Non-Compliance facilities), a slug-control plan, and SOPs plus calibration records for every piece of equipment on the train — the POTW inspects hardware and paperwork on the same visit. The 2026 OPEX band for a 50,000 m³/yr North Billerica-area fab lands in the USD 0.8–1.4/m³ total chemical OPEX range (HydropureWater field data, 2025–2026). The top four OPEX lines are CaCl₂ plus Ca(OH)₂ at 35–45% of chemical OPEX, NaOH, cationic polymer, and MBR aeration electricity. Sewering treated effluent runs roughly 5–10× cheaper per m³ than hauling liquid hazardous waste off-site (per industry benchmarks, 2025-09), which is the economic case for designing to the local SUO rather than the federal floor. Three audit failures keep showing up in 2025–2026 inspections. First, fluoride spikes from incomplete BHF segregation, where one cross-connected floor drain swings 15→80 mg/L within an hour. Second, TMAH breakthrough into the main aeration basin, which crashes nitrification and pushes NH₃-N above 50 mg/L for days. Third, colloidal silica from CMP passing the clarifier and driving SS above 200 mg/L. The mitigation pattern is the same each time: online F⁻ and NH₃-N analyzers on the PLC, PLC-controlled chemical dosing on pH/ISE feedback, and 24-h composite sampling for heavy metals. For arsenic-line chemistry that often rides the same train, see this semiconductor arsenic wastewater treatment guide.
| Failure mode | Trigger | Detection window | Mitigation |
|---|---|---|---|
| F⁻ spike from BHF cross-connection | Shared floor drain during tool dump | 15→80 mg/L within 1 h | Online F⁻ ISE on combined header; PLC dose trim |
| TMAH breakthrough to aeration | Slug during developer tank dump | NH₃-N >50 mg/L for days | Side-stream MBR; online NH₃-N on PLC |
| Colloidal silica from CMP | Clarifier overload during slurry dump | SS >200 mg/L | DAF for float loading; 24-h composite sampling for metals |
Frequently Asked Questions
What fluoride limit applies to a fab discharging to a Massachusetts POTW?
A typical Massachusetts POTW SUO caps fluoride near 15 mg/L, which is tighter than the 40 CFR Part 413 categorical daily-maximum ceiling of roughly 32 mg/L. The 15 mg/L number becomes the design target for the precipitation stage, and the dosing skid should hold that band with online F⁻ ISE feedback.
Can TMAH be sent to the central POTW?
No. TMAH-N above 10 mg/L in mixed liquor inhibits nitrification and a slug will crash a biological plant for days. Treat the developer header on-site in a side-stream MBR sized at 1.0–1.5 kg COD/m³·day with 12–24 h HRT, then strip the resulting NH₃-N below 30 mg/L before discharge.
What 2026 OPEX should a 50,000 m³/yr fab budget for pretreatment?
USD 0.8–1.4/m³ total chemical OPEX, dominated by CaCl₂ plus Ca(OH)₂ at 35–45% of the chemical line, followed by NaOH, cationic polymer, and MBR aeration electricity (HydropureWater field data, 2025–2026). Sewering treated effluent runs roughly 5–10× cheaper per m³ than hauling liquid hazardous waste off-site.
DAF or lamella for the fluoride header?
DAF at 4–300 m³/h for high float loadings and colloidal silica from CMP; lamella at 20–40 m/h surface loading for tight footprints. Both deliver overflow TSS in the 30–60 mg/L band when upstream chemistry holds at pH 6–8 and the Ca²⁺:F⁻ molar ratio is near 2.5:1.
What monitoring will the POTW look for at the next 5-year permit cycle?
pH and F⁻ ISE on the combined effluent header, on-line ICP-OES or XRF for Cu, Ni, and Cr, continuous flow, and SOPs plus calibration records for every piece of equipment on the train. Monthly DMRs and a slug-control plan are the document set inspectors read first.