
What Polymer Overdosing Looks Like in a Real Plant
Polymer overdosing is diagnosed when effluent quality worsens as polyacrylamide (PAM) dose rises — the signature of restabilization. The mechanism is straightforward: once excess PAM saturates the adsorption sites on suspended particles, free polymer segments left in solution begin breaking the bridges already formed, so flocs weaken as dose climbs. The plant rarely looks broken — water still clarifies, sludge still dewaters — but you are paying for chemistry that is actively undoing its own work. Field data shows roughly 40% of plants that submit samples for re-optimization are running above their true optimum (chinapolyacrylamide.com, 2026).
Overdose almost never starts as a deliberate decision. It accumulates through predictable patterns: seasonal dose increases that are never reversed, escalation in response to a single effluent complaint, a new higher-activity PAM batch from the same supplier that delivers more active polymer at the same pump setting, or lower feed solids after a production slowdown while the dose stays at the level set for higher loading. Contrast this with underdosing — both can produce turbid effluent and pin floc, but in overdosing, adding more polymer makes the problem measurably worse within an hour, which is the diagnostic pivot. Plants running an automatic polymer dosing skid with logged trend data can confirm that pivot in minutes by overlaying turbidity against the dose curve.
Seven Warning Signs Ranked by How Fast You Can Spot Them
The fastest path to a correct diagnosis is a ranked checklist. The seven indicators below are ordered from the easiest visual confirm to the slowest trend signal; one or two positive findings is enough to justify a jar test, and three or more is enough to start a stepdown plan (chinapolyacrylamide.com, 2026).
| # | Symptom | Most Likely Cause | One-Line First Test |
|---|---|---|---|
| 1 | Slippery biofilm-like coating on tank walls, scrapers, and weirs | Excess polymer hydrating on surfaces; restabilization | Wipe wall, feel for tackiness; compare against a clean baseline photo. |
| 2 | Rising effluent turbidity despite higher dose | Charge reversal of suspended solids | Plot turbidity vs. dose over the last 14 days; look for a positive slope. |
| 3 | Persistent white/grey foam that does not dissipate | Dissolved polymer increasing surface tension | Check surface tension (mN/m) and recent dose escalations. |
| 4 | Belt press or centrifuge blinding with 30–50% higher wash-water use | Residual polymer blinding the media | Log filter cloth ΔP and cake release against baseline. |
| 5 | Downstream COD spike or foaming in the receiving water | Polymer carry-over into effluent | Compare effluent COD to baseline; check receiving water for foam. |
| 6 | Fragile 5–10 mm flocs that shear easily | Flocs held together by excess, weakly-bound polymer | Stir a sample gently; if large flocs collapse, the bridge is fragile. |
| 7 | Rising polymer $/m³ with stable flow and influent | Cumulative dose creep over weeks/months | Plot $/m³ against monthly average; flag any month above +10%. |
Pin floc — the very small, light flocs that float instead of settling — is the symptom most often confused with underdosing because both produce a hazy overflow (tpomag.com, 2018-05). The difference is direction: if adding more polymer makes pin floc worse, you are overdosing. The top two symptoms in the table (slippery walls, rising turbidity at higher dose) are direct expressions of charge reversal and should trigger a bench test the same shift.
The 15-Minute Field Test: Confirm Overdosing Before You Change Anything
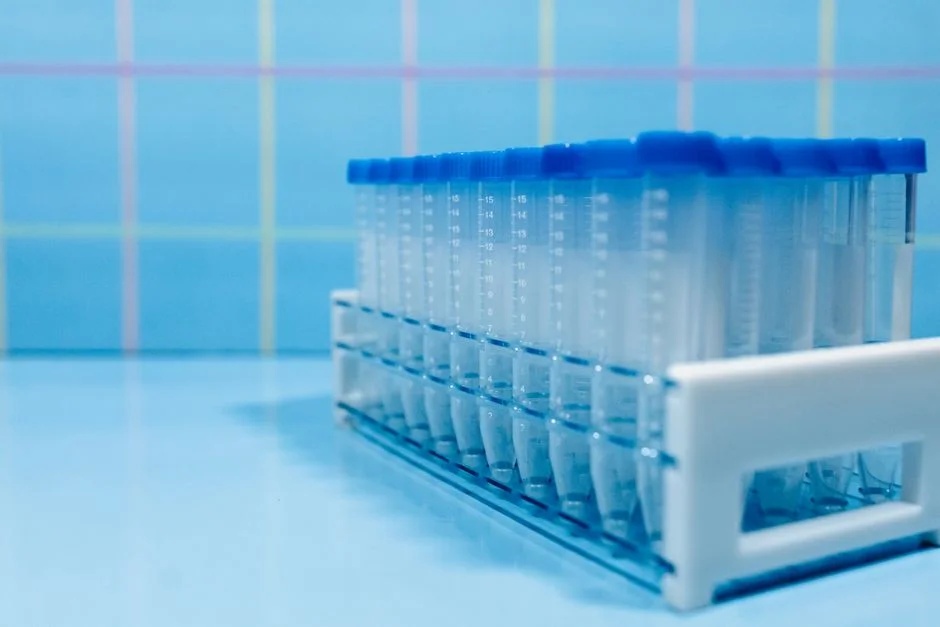
Run this test on shift before scheduling a jar test. Record the baseline effluent turbidity and the current polymer pump setting, then reduce feed by 15–20% for one hour. Sample the same clarifier or DAF outlet every 15 minutes and log the trend. If clarity improves over the hour, overdosing is confirmed — proceed to a full jar test to find the true optimum. If clarity worsens, the plant is underdosed and dose should be returned to baseline immediately, not pushed lower (hychron.com).
Hold the coagulant dose constant throughout the test so the response can be attributed to PAM alone. Sample at the same point and the same depth each time, and record influent flow and TSS so the result is auditable later. The 10–15% weekly stepdown cadence used in the recovery plan below is deliberately smaller than this 15–20% field cut — the field test is a one-hour diagnostic, not a recovery move, and a too-large overnight cut can collapse a sludge blanket held together by residual polymer (chinapolyacrylamide.com, 2026). For influent variability, an automatic sampler for wastewater gives the paired inlet/outlet data that makes this test defensible in an ISO 14001 audit.
Jar Test Protocol That Actually Finds the Optimum
No formula or table replaces a jar test on a representative sample from your own plant. The protocol below is the one referenced by every primary source on PAM optimization and the one most operators never get a complete parameter set for (hychron.com; chinapolyacrylamide.com, 2026). Run it before changing the full-scale setpoint.
| Step | Parameter | Value |
|---|---|---|
| Sample collection | Composite, representative of current feed | 1 L per beaker, 6 beakers |
| Coagulant dose | Constant across all beakers if used | Per current plant setpoint |
| PAM doses | Multiplier of current feed rate | 0.5×, 0.75×, 1×, 1.25×, 1.5×, 2× |
| Rapid mix | Disperse polymer | 200–300 rpm for 30–60 s |
| Slow mix | Build floc, G ≈ 50–75 s⁻¹ | 25–50 rpm for 5–10 min |
| Settling | Allow blanket to form | 15–30 min quiescent |
| Evaluation | Supernatant turbidity, settled sludge volume, floc size, filtrate clarity | Record all four per beaker |
| Acceptance criteria | Pre-defined before the test | Turbidity ≤ target NTU; SVI within band |
| Bench sheet | Feed TSS, pH, conductivity, temperature | Documented for scale-up |
Target the lowest dose where turbidity and settled solids both meet criteria — not the beaker with the largest visible floc. Larger flocs at higher doses usually mean the system is approaching the overdose threshold; the same mechanism that produces a "good-looking" floc at 1.5× is the one that drives pin floc at 2×. Keep make-down concentration, solution age, mixing sequence, settling time, and evaluation method identical across all six beakers so the only variable is the dose itself (sewagewatertreatment.com). The lowest effective dose is the one you scale up. Plants running the bench test on an automatic polymer dosing skid typically convert the result within the same shift, because the skid holds the new setpoint without operator drift.
Four-Week Stepdown Plan With Downstream Monitoring
Do not cut dose by 50% overnight — a sludge blanket held together by residual polymer can take 3–7 days to reveal its true state, and a too-large cut can crash effluent before the operator has data. The protocol below is the controlled path from the jar-test optimum to a locked full-scale setpoint (chinapolyacrylamide.com, 2026).
| Week | Dose Action | Monitor | Hold Rule |
|---|---|---|---|
| 1 | Reduce feed by 10–15% from starting point | Effluent turbidity vs. baseline (±5 NTU), settling rate, foam/weir cleanliness | Turbidity drifts > 10% from baseline → hold |
| 2 | Reduce another 10–15% if Week 1 held | Above + belt-press or centrifuge cake %DS | Cake %DS drops > 1 percentage point absolute → hold |
| 3 | Reduce another 10–15% if Week 2 held | Above + polymer $/m³ and sludge inventory | Sludge inventory growth > 10% above baseline → hold |
| 4 | Reduce to jar-test optimum if previous weeks held | Full matrix; same as Week 3 | Any monitored parameter degrades > 10% → revert to prior week |
| Lock | Two consecutive stable weeks define the new baseline | Confirmation jar test against new setpoint | Lock the setpoint only after jar validation |
The downstream checkpoints matter as much as turbidity. A dose cut that holds effluent clarity but drops cake %DS by more than 1 percentage point absolute is moving cost from chemistry to hauling — a plate and frame filter press running at lower cake solids will reject more water and burn more polymer downstream. Plants that cannot reduce below 15% from starting dose usually have a different root cause: wrong PAM grade for the feed, inadequate mixing energy at the injection point, or coagulant underdosing masking the real optimum (chinapolyacrylamide.com, 2026). For facilities integrating new units during the stepdown, the skid-mounted treatment plant maintenance checklist covers the mechanical side of the change window.
What It Saves: Payback by Plant Size
The savings are concrete and plant-specific. Source data puts the waste band at $18,000–$72,000/year for typical industrial plants running at roughly 2× optimal dose, with a 10,000 m³/day municipal WWTP example near $48,000/year wasted (chinapolyacrylamide.com, 2026). For municipal scale, the TPOMag benchmark estimates chemicals at about 6% of OPEX at a 100,000 m³/day plant spending $21,000/day — a 30% polymer cut at that scale returns a six-figure annual saving (tpomag.com, 2018-05). Industrial facilities processing mining tailings or oil sands at higher dosages can exceed $200,000/year in waste before optimization.
Use this formula to put a number on your own plant: (current $/m³ × current dose − optimized $/m³ × optimized dose) × annual flow = annual savings. The realistic improvement band is 30–50% chemical reduction, with most plants stabilizing at the lower end after a 4-week stepdown. Savings are not only chemical: lower polymer carry-over reduces effluent COD, cuts sludge volume, and trims downstream hauling cost. The full payback window is usually inside one quarter of chemical spend recovered, which is the number to bring to management. For broader context on unit operations tied to this cost line, the UF membrane troubleshooting guide shows how upstream polymer carry-over fouls downstream membranes and inflates CIP frequency.
When High Dose Is Not Overdosing
Not every high-dose situation is overdosing. Legitimate reasons to run above the typical band include high-TSS or high-COD industrial streams, wash-out events after a process upset, start-up of a new biological process before biomass acclimates, and known hard-to-treat feeds where jar testing has confirmed the elevated setpoint (chinapolyacrylamide.com, 2026). The governing rule is simple: the difference between a correct high dose and overdosing is jar test validation, not the dose number itself.
Re-run the jar test whenever influent character shifts rather than assuming the previous optimum still applies. As a compliance anchor, AWWA B453 sets a maximum dosage of 1 mg/L active polymer for potable applications and a 0.05% maximum residual monomer content; industrial plants have no regulatory dose ceiling, but economic optimization still applies. If your jar test confirms 20 ppm is optimum and you are running at 20 ppm, you are not overdosing — your water is just hard to treat.
Re-Optimization Cadence and Trigger Events
Lock in the habit so the plant does not drift back into overdosing six months later. Mandate a jar test on every new PAM batch from the same supplier because molecular weight and charge density vary batch-to-batch, especially when the previous batch was running at the low end of the dosage range (hychron.com). Set fixed re-test triggers: production rate change, new PAM batch, season change, any unexplained effluent deterioration, and monthly for facilities with highly variable influent.
Build the cadence into a written dose-adjustment protocol that all shifts follow so individual operators do not drift the setpoint in response to a single bad sample. Connect the cadence to ISO 14001 resource-efficiency documentation requirements for plants under environmental management systems — logged jar tests, recorded batch numbers, and paired chemical-consumption data are the audit evidence that demonstrates the resource efficiency principle is being met (chinapolyacrylamide.com, 2026).
Frequently Asked Questions
How do I tell overdosing from underdosing without a lab?
Cut the current polymer dose by 15–20% for one hour and watch the same clarifier outlet. If effluent turbidity improves, you were overdosing; if it worsens, you were underdosing and should return to the previous setpoint. Follow up with a full 6-beaker jar test to find the true optimum before making any further change.
How often should I re-optimize PAM dosage?
At minimum, re-run a jar test on every new PAM batch, at every season change, after any significant production-rate shift, and whenever effluent quality deteriorates without an obvious cause. For plants with highly variable influent, monthly jar testing is the realistic cadence; for stable municipal feeds, quarterly is the floor.
Can I use the same dose for different batches from the same supplier?
No. Even from the same supplier, batch-to-batch variation in molecular weight and charge density shifts the effective dose, especially when the previous batch was running at the lower end of the dosage range. Always run a comparative jar test on the new batch before locking the setpoint.
How much can polymer spend realistically be cut?
Most plants stabilize at 30–50% below their starting dose after a controlled stepdown, with the $18,000–$72,000/year waste band as the order-of-magnitude range for typical industrial facilities. A 10,000 m³/day municipal WWTP example lands near $48,000/year wasted at 2× optimum; larger municipal plants at 100,000 m³/day scale that to six figures annually.
Is high turbidity at high dose always polymer overdosing?
No. Coagulant overdose — for example, ferric chloride pushed too hard for phosphorus removal — can cause charge reversal of its own and destabilize suspended solids (tpomag.com, 2018-05). Check the coagulant dose and jar test it independently before cutting PAM; the diagnostic pivot is which chemical, when cut, restores clarity within the hour.
Related Equipment
- DAF flotation system — specifications, capacity range, and technical data