Ultrafiltration Troubleshooting: Three Symptoms That Drive Every Decision
Ultrafiltration troubleshooting reduces to three measurable symptoms: declining permeate flux in LMH, rising transmembrane pressure (TMP) in bar or psi, and deteriorating permeate quality. Flux loss points to surface fouling or polarization; TMP rise signals pore restriction or compression; quality loss usually means fiber or seal failure, not chemistry.
Each symptom points to a different root cause. A field operator should not start any CIP cycle until they know which of the three they are looking at. UF membranes operate in a 0.01–0.1 µm pore size range. That range rejects bacteria, most viruses, and high-molecular-weight organics.
It also makes modules sensitive to particulates just above their rating. A feedwater upset that pushes colloids or precipitated salts into that size window will foul a UF module within hours.
Operators also need to know that 5–15% of the feed stream routinely exits as concentrate waste. A perceived "permeate loss" is often just concentrate management, not membrane failure. The action threshold that triggers a Clean-In-Place (CIP) cycle is a 10–15% increase in TMP from the clean baseline. A flux loss greater than 10% from the design point is the parallel trigger.
Most fouling — organic, colloidal, scaling, or biological — is reversible if the correct chemical recipe is applied within roughly 30 days. After that window, foulants compact and recovery drops sharply. Anything beyond two failed CIP cycles should be escalated to integrity testing before the operator spends money on a third chemical bath.
Diagnosing the Foulant: A Symptom-to-Cause Decision Framework
Foulant identification is the highest-leverage step before any chemical valve opens. A wrong CIP choice wastes a cycle and may compact the foulant further. The four foulant families — organic, colloidal, scaling, and biological — each leave a distinct signature in the operating data. Most plants we size for can name the culprit within a few minutes of trend review.
Organic fouling shows up as a sudden flux loss with stable TMP. Scaling produces a gradual TMP rise at constant flux. Biological fouling combines a TMP climb with a sulfur or earthy odor. It also correlates with warm, low-flow periods in the feed.
Scaling comes from four primary minerals in industrial UF service: calcium carbonate, calcium sulfate, silica, and barium sulfate, with calcium and magnesium being the most common in industrial feedwaters. The precursor is concentration polarization — dissolved salts concentrating at the membrane wall until local saturation is exceeded and precipitation begins. The Langelier Saturation Index (LSI) on a feed grab sample is the fastest screen. An LSI above zero means the water is scale-forming.
Higher positive numbers mean a stronger scaling drive.
For biological fouling, the Water Research Foundation documented a desalination plant where algal-bloom peaks were worsened by high-shear pumps fragmenting cells. Switching to low-shear pumps during bloom events reduced fouling significantly. Shift diagnostics start with jar tests for scaling potential and visual checks of backwash color and sludge.
SDI trending on permeate detects early fiber breach. When chemistry alone fails, membrane autopsy is the last step. Autopsy is destructive, but it identifies exactly what sits on, in, and under the membrane surface.
| Symptom signature | Probable foulant | Field diagnostic | First-line chemistry |
|---|---|---|---|
| Sudden flux loss, TMP stable | Organic / colloidal | Backwash water color, feed turbidity trend | Alkaline CIP (NaOCl) |
| Gradual TMP rise at constant flux | Scaling (Ca, Mg, silica) | Feed LSI, conductivity of concentrate | Acid CIP (citric / HCl) |
| TMP climb + odor, warm season | Biological / biofilm | Backwash sludge, ATP swab, feed temp log | Alkaline CIP, then enhanced chlorine soak |
| Permeate SDI/turbidity rising | Fiber breach or seal failure | Pressure decay / bubble point test | None — replace module |
What Does Membrane Fouling Cost a Plant?
Membrane fouling cost shows up first as lost production time, extra chemical spend, and premature module replacement. It rarely appears as a single line item on a quote. Each unnecessary CIP burns NaOCl or acid inventory plus 1–3 hours of recirculation labor. Two failed cleanings already signal that further chemistry is money wasted.
A single misdiagnosed replacement on a multi-rack skid can run into six figures, so integrity numbers should decide the swap, not flux trends alone.
Why does membrane fouling raise operating cost?
Membrane fouling raises operating cost when operators clean with the wrong chemistry, miss the roughly 30-day reversible window, or replace modules without integrity proof. Hidden cost also sits in concentrate handling: 5–15% of feed routinely leaves as reject. Operators who chase that "permeate loss" as a membrane fault often overspend on CIP before checking balances.
Delayed cleaning past the roughly 30-day reversible window raises compaction risk. Recovery may never return to the ≥90% flux pass criterion. Specifying a correctly sized Ultrafiltration (UF) Water Treatment System with documented TMP and flux baselines cuts those avoidable OPEX spikes.
Clean-In-Place Protocols: Chemical Recipes, Soak Times & Expected Recovery

A field-ready CIP playbook is built around two chemical stages plus a mandatory rinse, executed at controlled temperature. Step 1 is alkaline CIP for organic and biological fouling. Dose sodium hypochlorite to 200–500 mg/L free chlorine, adjust pH to 10–11 with NaOH if needed, and recirculate 30–60 minutes. Target at least 90% flux recovery against the clean baseline.
Step 2 is acid CIP for scaling: 1–2% citric acid or hydrochloric acid at pH 1–3. Soak 30–60 minutes. Expect the solution pH to drift upward as the scale dissolves. Between the two stages, a permeate rinse of 10–15 minutes is mandatory.
Skipping it risks chlorine gas from residual hypochlorite contacting acid. It also risks salt precipitation in the membrane pores.
Temperature is a hard limit. For PVDF UF membranes, never exceed 35–40°C during CIP. Above that range, the polymer loses hydrophilicity. One hot cycle can damage the membrane irreversibly.
Successful CIP returns TMP to within 5–10% of the clean baseline and restores at least 90% of initial flux. If those numbers are not hit after two consecutive cycles, stop the chemicals. Move to integrity testing next. Failed cleanings we review most often trace to the wrong chemical choice rather than insufficient contact time.
For automated operation, a PLC-controlled chemical dosing system lets the operator program the two-stage recipe, interlock the rinse step, and log every parameter against the TMP and flux trends.
| CIP stage | Target foulant | Chemical & dose | pH window | Soak / recirculate | Temperature ceiling | Pass criterion |
|---|---|---|---|---|---|---|
| Alkaline | Organic, biological | NaOCl 200–500 mg/L free Cl₂ | 10–11 | 30–60 min | 40°C (PVDF) | ≥90% flux recovery |
| Rinse | Between stages | Permeate flush | Neutral | 10–15 min | Ambient | Conductivity back to feed |
| Acid | Ca/Mg/silica scale | Citric 1–2% or HCl to pH 1–3 | 1–3 | 30–60 min | 40°C (PVDF) | TMP within 5–10% of clean baseline |
Integrity Testing: Deciding Between Repair, Reuse, or Replace
Integrity testing determines whether a membrane is ruined through quantitative assessment. Two field methods dominate UF practice: the bubble point test and the pressure decay test, with vacuum hold as the alternative for submerged modules where pressurization is impractical. The bubble point test starts by draining the module, then pressurizing it with compressed air while the permeate side stays under water. Large, continuous bubbles from the permeate indicate torn or breached fibers.
The pressure decay test pressurizes the module with air, holds for 10 minutes, and measures the pressure drop. A drop greater than 0.1 bar/min typically indicates compromised fibers for 0.01–0.1 µm UF membranes.
Pass criteria for an intact UF module in current industry use: pressure decay below 0.05 bar over 10 minutes, and vacuum hold below 1% loss over 5 minutes. Anything above those thresholds points to a breach. Failed integrity means replacement. Passing integrity with persistently low flux means returning to CIP or scheduling a membrane autopsy.
Operators should not assume "low flux means dirty"; replacement decisions driven by integrity numbers are cheaper than decisions driven by flux trends alone. When in-house diagnosis is inconclusive, consult the manufacturer on a PVDF flat sheet UF membrane module before a swap-out. Apply the same discipline when evaluating a full-skid Ultrafiltration (UF) Water Treatment System retrofit.
Prevention Beats Recovery: A Practical UF Maintenance Schedule
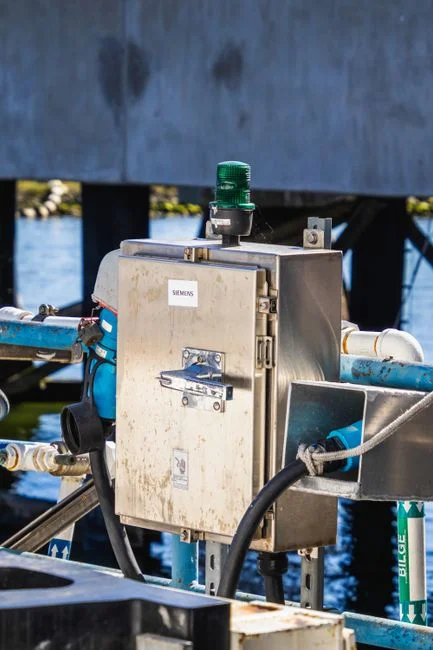
Proactive maintenance minimizes the need for emergency chemical cleaning. A maintenance schedule that any shift team can paste into the logbook breaks the work into four cadences.
Daily: log TMP, flux, and feed SDI; flag any 5% deviation from the rolling 30-day average. Weekly: pull the integrity pressure-decay trend even when permeate quality looks acceptable. A slow drift upward is the earliest signal of fiber fatigue.
Monthly: run an enhanced flux maintenance wash with low-concentration chlorine at 50–100 mg/L to prevent biofilm establishment. Quarterly: execute a full CIP cycle to reset the baseline. Tracking chemical consumption per cycle over time shows whether feedwater conditions are changing upstream.
Operator training is a top-3 lever for extending membrane life, alongside feed characterization and pretreatment discipline. For plants looking to standardize chemical handling across the schedule, a documented approach to automated chemical dosing for wastewater treatment removes the variability that manual dosing introduces. The downstream discharge envelope that those chemicals protect is detailed in the engineering reference on MBR effluent quality specifications.
Who This Is For / Who Should Look Elsewhere / Next Step
Plant engineers, EPC contractors, and operations leads who run industrial or municipal UF trains need a symptom-first path from TMP spike to CIP or replacement. Teams still selecting between microfiltration and reverse osmosis as the primary barrier should start with process design, not CIP recipes.
If logs show a 10–15% TMP rise or flux below the design point, send trend data and feed analysis with an inquiry for UF troubleshooting support. That lets sizing and chemistry be checked against the actual duty.
Frequently Asked Questions
What TMP value indicates a UF membrane needs cleaning?
A 10–15% increase in TMP from the clean-water baseline, or a flux loss exceeding 10% from the design point, is the field threshold for triggering a Clean-In-Place cycle. Operators should log the clean baseline at commissioning and update it after every successful CIP. Plants that skip the baseline update often clean too late, after foulants have already compacted.
How often should UF membranes be cleaned?
Symptom-triggered CIP plus a monthly preventive low-concentration chlorine maintenance wash (50–100 mg/L) and a full quarterly CIP regardless of symptoms is the standard cadence. Plants with high-biomass or high-hardness feed may need to shorten the interval based on TMP trend slope. Track chemical use per cycle; rising dose for the same recovery usually means upstream feed has changed.
What is the difference between backwash and CIP?
Backwash is a short, water-only reverse flow every 15–60 minutes that dislodges loose surface material; CIP is a chemically aggressive, multi-hour soak-and-recirculate using 200–500 mg/L hypochlorite or 1–2% acid that dissolves fouling. Backwash prevents surface cake build-up between production cycles. CIP restores permeability after organic, biological, or scale fouling has already stuck.
Can fouled UF membranes be restored to original performance?
Most fouling is reversible to at least 90% of clean-water flux if the correct chemical recipe is applied within roughly 30 days of the fouling event. Beyond that window, or after two failed CIP cycles, the operator should move to integrity testing or schedule a membrane autopsy. Autopsy distinguishes compacted foulant from fiber breach before another chemical budget is spent.
How do you test UF membrane integrity without removing it from service?
The in-situ pressure decay test pressurizes the isolated module with air, holds for 10 minutes, and measures pressure drop; a drop below 0.05 bar/10 min confirms intact fibers for 0.01–0.1 µm UF. Vacuum hold (less than 1% loss over 5 minutes) is the equivalent for submerged modules that cannot be pressurized. Results above those limits mean replace the module, not another CIP attempt.
Related Equipment
- UF systems with automatic backwash and air scour — Fouling recovery is easier when the train has automatic backwash and air scour.