Why San Antonio Data Centers Face a Different Cooling-Water Problem in 2026
A San Antonio data center cooling loop runs harder than the same megawatt rating in Boston or Atlanta, and that translates directly into larger and more concentrated blowdown streams. UT Austin researchers project that data centers could account for 3% to 9% of Texas water demand by 2040, and KSAT's 2026 reporting confirms 36 data centers already operate inside SAWS' Bexar County service area, meaning the cumulative discharge load on the Edwards Aquifer-adjacent sewer system is no longer a hypothetical. South Texas design wet-bulb temperatures sit in the 60–80°F range for most of the year, so even with efficient adiabatic assist, hyperscale operators push cycles of concentration to 6–8 to control water cost. The trade-off is a blowdown stream that carries roughly 6–8× the dissolved solids of the makeup water, plus every corrosion inhibitor and biocide that the cooling-water program has been adding for the past month.
Layered on top of the climate problem is a regulatory transparency shift. KSAT reported in July 2026 that the Texas Attorney General's February 2026 opinion on Government Code §552.1331 now shields commercial AMI smart-meter data — including data center water usage — from public-records requests, which is the exact opposite of what the bill's author intended. The practical effect for engineers is that on-site self-monitoring, in-house labs, and reuse-side water accounting are no longer optional ESG niceties; they are the only auditable record an operator controls. Cooling-tower blowdown is the concentrated reject stream left after evaporative cooling: salts, hardness ions, silica, heavy metals from corrosion inhibitors, and residual biocides do not evaporate with the steam and accumulate in the recirculating water until the operator intentionally bleeds it (per Water Utility Report, 2026-04).
Blowdown Chemistry: What a San Antonio Cooling Loop Actually Discharges
Edwards Aquifer and SAWS makeup water typically enters a cooling system at 300–600 mg/L hardness as CaCO₃ and 200–400 mg/L TDS, which is moderate compared to Permian Basin brine but aggressive enough to force scale-inhibitor programs above 50 mg/L. Once an operator runs 6–8 cycles to manage evaporative loss, the blowdown leaving the tower basin will read 2,500–5,000 mg/L TDS, 250+ mg/L silica as SiO₂, and measurable copper, zinc, and iron from the yellow-metal and carbon-steel corrosion inhibitor package. Residual oxidizing biocides — chlorine dioxide, stabilized bromine — exit at 0.1–1.0 mg/L as Cl₂, and non-oxidizing biocides (isothiazolones, DBNPA) show up at ppb to low-ppm levels that the SAWS pretreatment program flags as priority pollutants. pH drift to 8.0–9.0 from alkaline scale programs further narrows the discharge envelope, since direct release outside the SAWS pH 5.0–11.0 band triggers an automatic non-compliance finding.
| Parameter | SAWS Makeup Baseline | Blowdown at 6 cycles | Blowdown at 8 cycles | SAWS Pretreatment Limit (typical) |
|---|---|---|---|---|
| Total Hardness (as CaCO₃) | 300–600 mg/L | 1,800–3,600 mg/L | 2,400–4,800 mg/L | No numeric limit; surcharge on TSS/TDS load |
| TDS | 200–400 mg/L | 2,500–3,200 mg/L | 3,200–5,000 mg/L | Report only; TDS surcharge per 1,000 gal |
| Silica (SiO₂) | 20–40 mg/L | 120–240 mg/L | 160–320 mg/L | No numeric limit; scaling risk in POTW |
| Cu / Zn / Fe (total) | < 0.05 mg/L each | 0.3–1.5 mg/L | 0.4–2.0 mg/L | Cu 1.0 mg/L; Zn 2.0 mg/L; Fe 5.0 mg/L (per SAWS IPP) |
| Residual Oxidizing Biocide (as Cl₂) | 0 | 0.1–0.5 mg/L | 0.1–1.0 mg/L | < 0.1 mg/L at POTW headworks (dechlorination required) |
| Non-Oxidizing Biocide (isothiazolone) | 0 | 5–25 mg/L | 5–25 mg/L | Case-by-case review; chronic toxicity trigger |
| pH | 7.0–8.0 | 8.0–8.8 | 8.2–9.0 | 5.0–11.0 (instantaneous) |
The takeaway is that the limiting parameters are not TDS — they are heavy metals, residual oxidant, and silica, because the first two trigger SAWS surcharges and pretreatment fines while silica forces RO recovery ceiling to 75–80% to stay below saturation.
TCEQ, SAWS, and Edwards Aquifer Rules That Govern 2026 Discharge
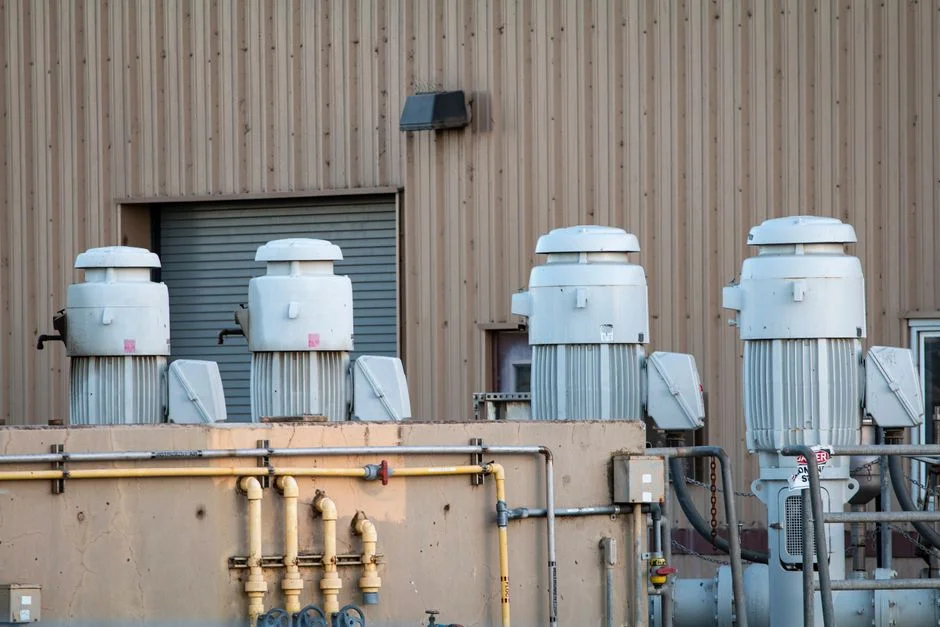
Three permit paths exist for a San Antonio data center blowdown stream, and the choice between them sets the entire equipment spec. Path 1 — sewer discharge under the SAWS Industrial Pretreatment Program (IPP) — requires compliance with categorical and conventional pollutant limits (Cu 1.0 mg/L, Zn 2.0 mg/L, Fe 5.0 mg/L, TSS 250 mg/L daily max, oil & grease 100 mg/L) and payment of a Sewer Treatment Surcharge per 1,000 gallons of returned flow, indexed in the model supply agreement at §4.4. Path 2 — on-site reuse for cooling makeup — falls under TCEQ Type I reclaimed water standards in 30 TAC §210 and §211, with strict TDS, pH, and biological limits (typically < 5 mg/L BOD/TSS, < 1 NTU turbidity) and requires an engineering report and a 6–12 month review. Path 3 — direct surface discharge under a TPDES permit (30 TAC §305) — is rare in Bexar County because the San Antonio River and Medina Lake watersheds are listed as impaired segments and the permitting lead time runs 18–30 months. The February 2026 Texas AG opinion on §552.1331 sharpens the incentive to keep blowdown on-site: if the operator runs an internal reuse loop with a PLC-trended flow and chemistry record, that data set is the only verifiable water-use audit the company can publish, which is exactly the record ESG reviewers and TCEQ inspectors will look for.
| Discharge Path | Governing Authority | Key Limits | Typical Lead Time | Primary Cost Driver |
|---|---|---|---|---|
| SAWS Sewer (IPP) | SAWS + TCEQ IPP delegation | pH 5.0–11.0; Cu 1.0 / Zn 2.0 / Fe 5.0 mg/L; TSS 250 mg/L; O&G 100 mg/L | 30–90 days (existing IPP) | Surcharge per 1,000 gal; TSS/TDS loading fees |
| On-Site Reuse (Type I) | TCEQ 30 TAC §210, §211 | TDS < 500 mg/L; pH 6.5–8.5; BOD/TSS < 5 mg/L; turbidity < 1 NTU | 6–12 months engineering report | RO + polishing CAPEX; ZLD side-stream OPEX |
| TPDES Surface Discharge | TCEQ 30 TAC §305 | Site-specific, watershed-tied; typically TDS < 450 mg/L chronic | 18–30 months | Receiving-water monitoring; whole-effluent toxicity |
The 2026 Treatment Train for San Antonio Data Center Blowdown
A complete 2026 train for a 1 GW-class Bexar County campus runs five stages, with each stage sized to keep the downstream RO membranes inside warranty and the concentrate stream inside ZLD recovery economics. Stage 1 — Pretreatment: rotary bar screen (2–6 mm aperture) followed by an equalization basin sized for ≥ 8 hours HRT with PLC-controlled chemical dosing for pH trim and sodium bisulfite reduction of residual oxidant (anchor with a PLC-controlled chemical dosing skid that handles NaHSO₃, NaOH, and antiscalant injection from a single panel). Stage 2 — Softening and Clarification: lime/soda ash softening or weak-acid cation exchange to drop hardness below 50 mg/L as CaCO₃, followed by a DAF clarifier for cooling-tower blowdown pretreatment to float silica, FOG, and metal-hydroxide flocs down to < 1 NTU turbidity. Stage 3 — Polishing: a multi-media filter for RO pre-protection loaded with anthracite, sand, and garnet to drive the Silt Density Index below 3. Stage 4 — Reverse Osmosis: a brackish-water industrial RO system for blowdown reuse sized for 70–80% recovery, producing 200–400 mg/L TDS permeate suitable for cooling makeup; concentrate routes to Stage 5. Stage 5 — ZLD Side-Stream: a forced-circulation crystallizer or mechanical brine concentrator that recovers > 95% of the remaining water as distillate and yields a solid salt cake for landfill or beneficial reuse — the configuration that lets the operator keep the "Water Credits" clause in a Mega Compute-style supply agreement (per the Texas Water Intelligence 2025-12 model).
| Stage | Unit Operation | Inlet Spec | Outlet Spec | Recovery / Removal |
|---|---|---|---|---|
| 1 — Pretreatment | Bar screen + equalization + NaHSO₃ dosing | Raw blowdown, pH 8.0–9.0, ORP > 200 mV | ORP < 100 mV, TSS < 50 mg/L | ORP reduction > 50%; TSS > 80% removal |
| 2 — Softening + Clarification | Lime/soda + DAF | Hardness 2,400–4,800 mg/L; turbidity 20–80 NTU | Hardness < 50 mg/L; turbidity < 1 NTU | Hardness > 95% removal; TSS > 95% |
| 3 — Polishing | Multi-media filter | SDI 5–8; turbidity 1–3 NTU | SDI < 3; turbidity < 0.5 NTU | SDI reduction > 50% |
| 4 — RO | Brackish RO, 2-pass capable | SDI < 3; TDS 2,500–5,000 mg/L | Permeate 200–400 mg/L TDS | 70–80% recovery; 95–99% salt rejection |
| 5 — ZLD Side-Stream | Forced-circulation crystallizer | RO concentrate 8,000–15,000 mg/L TDS | Distillate < 50 mg/L TDS; solid cake | > 95% overall water recovery; zero liquid discharge |
Specify the system for a 95% overall water-recovery target, 6–8 cycles pre-blowdown, and < 1 NTU turbidity post-DAF to keep the RO warranty intact and the crystallizer feed above the scaling threshold. For a parallel look at how Boston handles cold-climate blowdown with a similar train but lower cycles, see the Boston cold-climate blowdown case.
Sizing for a 1 GW Class San Antonio Hyperscale Campus
Using the Mega Compute model agreement's 1 GW "Campus" design basis, the cooling load at 1.0 gpm per MW of evaporative duty produces roughly 4.4 MGD of recirculating flow, of which 0.3–0.8 MGD exits as blowdown at 6 cycles of concentration. That blowdown flow is the design feed to the train above, and every unit operation is sized off it. The pretreatment skid is oversized to 2× peak flow so it can absorb the COC swing from 5 to 8 cycles that the South Texas wet-bulb envelope forces between a March morning and an August afternoon. The equalization basin holds a minimum of 8 hours HRT at peak blowdown to buffer diurnal load and let the chemical dosing loop stay in linear range. The RO skid is sized at 1.2× design permeate flow so that one of two passes can be in clean-in-place without cutting cooling-tower makeup supply — the same redundancy logic that Atlanta operators use, detailed in the Atlanta ZLD and process design comparison.
| Parameter | Design Value | Notes |
|---|---|---|
| IT Load | 1 GW (Mega Compute model basis) | Reference case for sizing |
| Evaporative Cooling Demand | ~ 1.0 gpm/MW ≈ 4.4 MGD recirculating | Assumes hybrid adiabatic assist |
| Cycles of Concentration | 6 (nominal) to 8 (summer peak) | Driven by 60–80°F design wet-bulb |
| Blowdown Flow | 0.3–0.8 MGD (440–1,100 gpm) | Use 1.0 MGD as design feed for safety |
| Equalization HRT | ≥ 8 hours at peak blowdown | Buffers COC swing and ORP spikes |
| Pretreatment Sizing | 2× peak blowdown | Handles summer 8-cycle excursions |
| RO Permeate | 0.25–0.65 MGD (70–80% recovery) | 1.2× redundancy for CIP |
| ZLD Concentrate Feed | 0.05–0.15 MGD | Distillate recycled; solids to landfill |
Sewer vs. On-Site Reuse vs. Recycled-Water Partnership: 2026 Decision Framework
For a 1 GW San Antonio campus, the three discharge paths translate into very different CAPEX/OPEX profiles. Path A — SAWS sewer discharge — is the lowest first-cost option but exposes the operator to per-1,000-gallon surcharges and TDS/TSS loading fees, both indexed in the model agreement §4.4, plus any future rate case from SAWS' wholesale customers. Path B — on-site RO plus ZLD — is the highest CAPEX (crystallizer alone is a seven-figure line item at 0.1 MGD feed) but the lowest long-run OPEX, and it is the only configuration that lets the operator retain the Water Credits / Sustainability Certificates clause that drives the ESG case for hyperscale tenants (per Texas Water Intelligence 2025-12). Path C — a TCEQ Type I recycled-water supply agreement with the City or a neighboring utility — is the moderate-CAPEX option and the lowest water-supply risk, but it requires a 10–20 year offtake commitment and bakes in a "Change of Law" cost-sharing clause (per the model §4.3) that can move with the next legislative session.
| Path | Relative CAPEX | Relative OPEX | Lead Time | Water-Supply Risk | Best-Fit Campus Profile |
|---|---|---|---|---|---|
| A — SAWS Sewer Discharge | Low (pretreatment only) | High (surcharges + rising rates) | 30–90 days | Moderate (rate-case exposure) | < 50 MW; short hold period; < 5-year payback horizon |
| B — On-Site RO + ZLD | High (RO + crystallizer) | Low (water retained on-site) | 12–18 months | Very low (self-supplied) | Hyperscale 100 MW+; ESG mandate; 3–5 year payback justified |
| C — TCEQ Type I Supply Agreement | Moderate (polishing only) | Lowest (utility O&M) | 6–12 months (permit) + negotiation | Lowest (utility-backed) | 100 MW+ with a willing utility partner and long-term offtake |
Decision rule: choose Path A if the campus is under 50 MW or the hold period is under five years; choose Path C if a utility partner is available and willing to sign a 10+ year offtake; choose Path B only when the hyperscale scale and water-stress metrics justify a 3–5 year payback. For an analogous evaluation framework in a different regulatory environment, see the Austin's TCEQ discharge pathway for data centers and the underlying RO membrane manufacturer spec deep dive for component-level guarantees.
Frequently Asked Questions
What treatment does a San Antonio data center need for cooling-tower blowdown in 2026?
A 1 GW San Antonio campus running 6–8 cycles of concentration needs a five-stage train: equalization with dechlorination, softening plus DAF, multi-media polishing, brackish RO at 70–80% recovery, and a ZLD side-stream crystallizer. The train is sized for 0.3–0.8 MGD of blowdown (≈ 440–1,100 gpm), which is the typical envelope for a 1.0 gpm/MW evaporative cooling load at South Texas wet-bulb conditions (HydropureWater field data, 2026).
Can a San Antonio data center send cooling-tower blowdown directly to the SAWS sewer?
Yes, but only after meeting the SAWS Industrial Pretreatment Program limits (pH 5.0–11.0, Cu < 1.0 mg/L, Zn < 2.0 mg/L, TSS < 250 mg/L) and paying the Sewer Treatment Surcharge per 1,000 gallons of returned flow indexed in §4.4 of the model supply agreement. Direct discharge of untreated blowdown at 2,500–5,000 mg/L TDS will exceed the surcharge thresholds and trigger load-based fees.
What TCEQ permit governs on-site reuse of cooling-tower blowdown as cooling makeup?
TCEQ Type I reclaimed water standards under 30 TAC §210 and §211 govern on-site reuse for cooling-tower makeup, with limits of < 5 mg/L BOD/TSS, < 1 NTU turbidity, and a pH range of 6.5–8.5. The Mega Compute model supply agreement (Texas Water Intelligence, 2025-12) sets "Cooling Quality Standards" to Type I or strict Type II to protect downstream cooling infrastructure from TDS spikes and biological fouling.
How does the February 2026 Texas AG opinion on §552.1331 change data center water reporting?
The February 2026 AG opinion now shields commercial AMI smart-meter data — including data center accounts — from public-records disclosure under §552.1331, per KSAT's July 2026 reporting. Operators can no longer rely on SAWS-released records to document water use, so on-site flow meters, PLC trend logs, and in-house lab data are the only auditable record a San Antonio data center controls for ESG and TCEQ inspection purposes.