
What an MVR Evaporator Actually Does — and Why That Drives the Fault Map
A mechanical vapor recompression (MVR) evaporator is a heat pump wrapped around a forced-circulation loop: vapor boiled off the wastewater is compressed by a rotary lobe or centrifugal compressor, which raises its saturation temperature by roughly 8–12 °C, and that hotter vapor is then condensed on the heat-exchanger tubes to reboil the same liquor (S1 design description). Because the loop runs above saturation pressure, no boiling takes place inside the heat exchanger — an orifice downstream of the exchanger creates the pressure drop that flashes the hot liquid in the separator (S1). That single architectural choice is why heater scaling is a function of the preheat section and tube-wall temperature, not of the boiling section, and why the most common MVR faults cluster around four mechanisms: compressor rotor health, tube-side fouling, separator pressure integrity, and distillate-side contamination.
The energy envelope is narrow enough to use as a baseline. ENCON reports $0.01–$0.02 per gallon of treated water and YASA reports 6–48 kWh per ton of water evaporated (S1, S3). On a steady feed, any kWh-per-ton rise of 15–20% is a fouling alarm, not an efficiency complaint. The distillate target is <10 mg/L TDS with up to 95% volume reduction on the feed (S3); deviation from these numbers on a constant feed is a fault — feed variability must be ruled out before chemistry or instrumentation is touched. Operators familiar with high-salinity wastewater treatment and ZLD design will recognize these targets as the same benchmarks that govern the upstream crystallizer or brine concentrator downstream of the MVR.
The 30-Second Triage: Mechanical, Process, Chemical, or Instrument?
When the alarm panel lights and throughput drops, the on-shift operator has about 30 seconds to pick the right bucket before chasing the wrong cause. MVR evaporator troubleshooting sorts into four buckets: mechanical, process, chemical, and instrumentation. Pulling the alarm log, checking compressor current against its nameplate, and reading separator vacuum against the -0.7 to -0.9 bar(g) target takes less than a minute and rules out half the fault list.
Mechanical faults announce themselves physically: vibration, abnormal noise, rising bearing temperature, and motor current that drifts up at constant load. Process faults are visible only on the DCS: falling ΔT across the heat exchanger, separator vacuum rising toward atmospheric, flash temperature dropping, evaporation rate falling on a stable feed. Chemical faults require a lab pull or online analyzer: scaling rate jump, distillate TDS or COD climbing, foam in the separator sight glass, pH drift. Instrumentation faults are the trickiest because they masquerade as process faults — a single PT that disagrees with two redundant instruments, a conductivity probe that has not been cleaned, a level switch chattering at the same physical level it has sat at for months.
The Gotsu Mill startup experience illustrates how a single root cause can produce alarms in two buckets at once (S2). The Japanese pulp mill's two early-life failures — heater scaling and compressor vibration — looked like separate mechanical and process problems, but both traced back to inadequate startup conditioning. Salt carryover into the compressor caused the vibration; under-treated feed caused the scaling. Disciplined vapor-drain cleaning on the heater and open cleaning of the compressor rotor cleared both, and the mill reached 111% of prior pulp production with a 13% energy-cost reduction versus the multi-effect vacuum evaporator baseline (S2). The lesson: when a fault sits in two buckets simultaneously, walk both before drawing conclusions.
The Eight Failures That Actually Take MVR Units Down
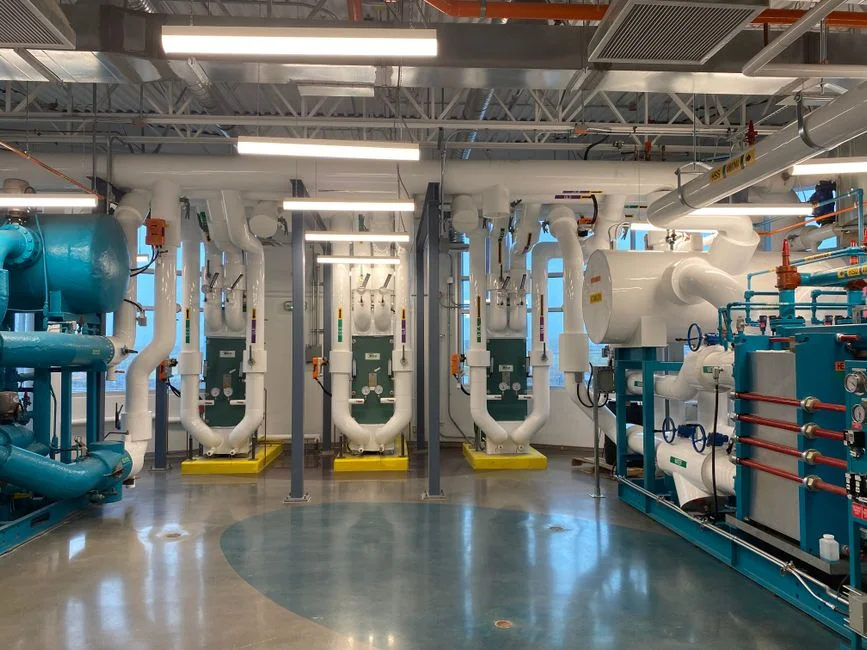
The table below ranks the eight MVR failure modes by approximate frequency in industrial wastewater service and pairs each with a measurable threshold, a first check, and a fix. Anything that does not clear inside one shift goes to the CIP recovery section.
| # | Failure | Symptom / threshold | Most likely cause | First check | Fix |
|---|---|---|---|---|---|
| 1 | Heater scaling & tube fouling | ΔT drops 2–3 °C at constant load; kWh per ton rises 15–20% | Inverse-solubility salts (CaSO₄, CaCO₃, silica) on tube walls | Inspect sight glass; pull a tube-side coupon if accessible | CIP with acid (carbonate) or alkaline EDTA (silica); Gotsu Mill used vapor-drain cleaning (S2) |
| 2 | Compressor vibration / surge | Vibration >7.1 mm/s RMS per ISO 10816-3; surging audible | Salt or liquid carryover into rotor; impeller fouling; bearing wear | Read vibration trend; check scrubber performance and separator level | Open cleaning of rotor; Gotsu Mill cleared this with open cleaning during commissioning (S2) |
| 3 | Separator vacuum loss | Pressure climbs from -0.7 to -0.9 bar(g) toward atmospheric | Condenser cooling-water failure; non-condensable accumulation; flange ingress | Verify cooling-water flow and temperature; check vacuum-pump seal | Restore cooling water; soap-test flanges; bleed non-condensables |
| 4 | Low distillate quality (TDS creep) | Distillate TDS rises >50% above the <10 mg/L baseline (S3) | Foaming with carryover; HX gasket leak; compressor seal-oil contamination | Lab sample; visual on separator sight glass | Adjust antifoam dose; inspect plate-HX gaskets; check seal-oil level |
| 5 | Compressor surge / capacity loss | Evaporation rate falls with stable feed, steam, and vacuum | Fouled impeller; worn clearances; inlet vapor outside map | Compare separator temperature to compressor published map | Clean rotor; reset operating point within map; replace worn rotor if clearances are out |
| 6 | Circulation pump loss / cavitation | Flow transmitter falls while pump amp is normal, then drops | NPSH loss from low separator level; vapor in suction line | Read separator level; check vent on suction line | Restore level; vent the suction; inspect mechanical seal |
| 7 | Foaming & carryover to distillate | Foam in separator sight glass; distillate COD climbing | High organics or surfactants in feed | Sample feed COD; review upstream DAF or biological performance | Dose antifoam; consider DAF pre-treatment ahead of an MVR evaporator |
| 8 | Instrumentation faults (level, conductivity, PT) | One reading disagrees with two redundant instruments | Probe fouling; calibration drift; trapped impulse line | Clean probe; blow down impulse line; compare to handheld | Recalibrate before assuming a process problem; replace probe if drift persists |
Failures 1 and 2 are the two the Gotsu Mill paper actually documents, and they remain the most common pair across chemical, metal finishing, food, and pulp & paper service (S2). Failure 3 — vacuum loss — is the one that masquerades as compressor surge because the operator sees capacity fall and assumes the rotor. Failure 7 — foaming — is the one that masquerades as scaling because the distillate TDS climbs and the operator reaches for the CIP skid when the real fix is antifoam and upstream DAF pre-treatment. The same diagnostic discipline applies across membrane-based upstream stages; the patterns in a UF troubleshooting and CIP recovery guide carry over directly when antifoam residuals or biological carryover reach the MVR feed.
Normal Operating Parameters You Should Be Logging Every Shift
Every operator should be logging these five numbers per shift; they catch roughly 90% of faults before they become alarms.
| Parameter | Normal range | Early-warning threshold | Action threshold |
|---|---|---|---|
| Compressor vibration (RMS) | <4.5 mm/s (new bearings) | Trending up over 7 days | >7.1 mm/s per ISO 10816-3 → open inspection |
| Separator vacuum | -0.7 to -0.9 bar(g) | Rising trend over 24 h | Loss of >0.1 bar(g) → cooling water / seal check |
| Main HX ΔT | Unit-specific baseline | 2–3 °C drop at constant load | >5 °C drop → run CIP |
| Energy (kWh per ton water) | 6–48 kWh (S3) | +15% at same feed | +20% → CIP or compressor wash |
| Distillate TDS | <10 mg/L (S3) | +50% above baseline | Carryover or gasket alarm |
Log these against feed rate, feed conductivity, and compressor current. A ΔT drop at constant load with rising kWh per ton points to heater scaling; the same ΔT drop with falling kWh per ton points to underload or sensor drift. Treat any parameter that drifts for three consecutive shifts as a fault even if it has not crossed the action threshold — drift is the early warning the S2 case study illustrates (HydropureWater field data, 2026).
CIP Recovery: Bringing a Fouled MVR Back to Baseline
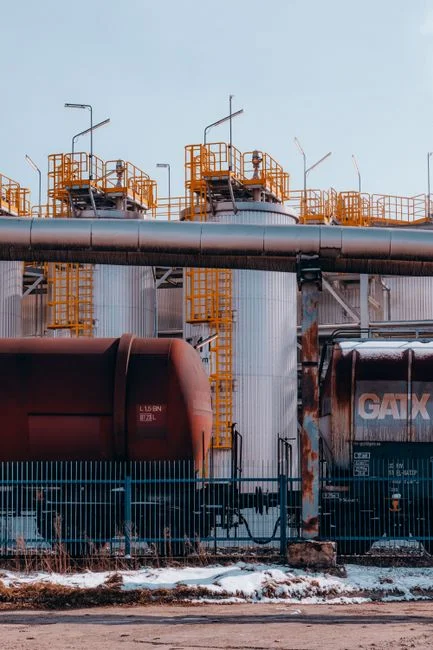
Clean-in-place is a standard automated feature on modern MVR packages per the S1 vendor spec, but most legacy systems were built before automated CIP and the operator has to run the sequence by hand. Either way, the chemistry has to match the scale.
For carbonate and phosphate scale — typical of cooling-tower makeup, hard-water blowdown, and many metal-finishing rinses — run an acid CIP at 2–5% nitric or citric acid, target 50–70 °C, recirculate 60–90 minutes, then rinse with clean water until the return conductivity matches the supply. For silica, organics, and biological film — typical of pulp & paper black liquor, food-industry concentrates, and landfill leachate — use alkaline EDTA or caustic with a surfactant at the same temperature band. Never mix acid and caustic without a water rinse in between; the salt precipitation will undo the cleaning.
Dosing accuracy matters as much as chemistry selection. Use an automatic chemical dosing system for MVR CIP cycles so concentration is held to setpoint across the full recirculation loop — hand-dosing produces the under-treatment that leaves a 10–15% capacity loss behind. After CIP, log kWh per ton and main ΔT; the unit should return to within 5% of the pre-fouling baseline. If it does not, the chemistry was wrong or the scale was under-treated. If CIP does not recover ΔT at all, the problem is not scale — it is mechanical, and the heat exchanger must be opened for tube or plate inspection. Protecting the loop with multi-media filtration as MVR feed protection ahead of the evaporator is the cheapest way to extend CIP intervals from weeks to months on most industrial feeds.
Preventive Maintenance Cadence That Prevents Most of These Calls
Paste this cadence into the CMMS as a recurring work order and the next shift will not be dealing with the same alarm.
Daily. Log ΔT, separator vacuum, compressor current, distillate TDS, and kWh per ton of water — the five numbers that catch 90% of faults early. A 15-minute end-of-shift review by the panel operator takes less time than one unscheduled CIP cycle.
Weekly. Visual inspection of compressor oil level and color, separator sight glass for foam or carryover, and pump mechanical seals for weep. Pull a full lab panel on the distillate (TDS, COD, pH, conductivity) and compare to the previous week.
Monthly. Vibration analysis trend on the compressor, instrument calibration check on level switches and conductivity probes, and a review of the last 30 days of kWh-per-ton data for drift.
Quarterly. Compressor oil change per manufacturer, full CIP cycle even if not yet triggered by the action threshold, and inspection-port checks on the heat exchanger for gasket weep.
Annually. Open the compressor for borescope or visual inspection of the rotor and bearings, replace gaskets proactively on plate heat exchangers, and verify the vacuum-pump seal. This is also the right interval to benchmark the unit against the nanofiltration or UF stage upstream; the same fouling indicators show up in a nanofiltration system troubleshooting guide and the two systems usually share a feed-water root cause.
Frequently Asked Questions
What vibration level on an MVR compressor requires immediate shutdown?
Per ISO 10816-3, vibration above 7.1 mm/s RMS on a rigid-mounted machine in the 300–600 kW class is the alarm threshold; above 11 mm/s RMS the unit should be shut down and the rotor inspected. The Gotsu Mill paper documented a startup-period vibration that traced to salt carryover into the rotor and was cleared with open cleaning during commissioning (S2).
How do I tell the difference between heater scaling and compressor surge?
Both cause falling evaporation rate on a stable feed. Scaling shows up first as a 2–3 °C ΔT drop at constant load and a 15–20% rise in kWh per ton of water; the compressor current stays flat. Compressor surge shows up as falling evaporation rate with separator temperature drifting outside the compressor's published map and vibration rising above 4.5 mm/s RMS. If both numbers move together, the root cause is usually upstream carryover and both subsystems need attention.
What is the right CIP chemistry for silica scale on an MVR?
Silica and silica-bearing scales require alkaline EDTA or caustic with a surfactant at 50–70 °C with 60–90 minutes of recirculation. Acid CIP will not touch silica and will leave the unit under-treated; verify recovery by logging kWh per ton and main ΔT after the rinse and confirming a return to within 5% of the pre-fouling baseline.