Why HF Etch Wastewater Is a Different MBR Problem
Free fluoride (F⁻) — not BOD — sets the design constraint for any membrane bioreactor (MBR) treating hydrofluoric acid (HF) etch rinse waste. HF etch streams typically run at <50 m³/day per line, BOD/COD of only 50–300 mg/L, TDS of 1,000–5,000 mg/L, and free F⁻ of 50–1,500 mg/L depending on rinse stage, with episodic tool-on/tool-off pH swings as the etch bath refreshes. F⁻ complexes Mg²⁺ and Ca²⁺ cofactors in bacterial enzymes, and unacclimated biomass loses nitrification at IC50 values published between 20 and 50 mg/L F⁻ (per the PMC review, 2023). A conventional activated-sludge plant (ASP) cannot hold the long solids retention time (SRT) needed to acclimate biomass; a submerged MBR can, which is why MBR is the right technology here. The two-stage framing that follows — calcium precipitation to drop F⁻ below ~20 mg/L, then MBR polishing for residual organics, NH₃-N, and TSS — is the only defensible path for a 2026 capex submission on this stream.
Characterize the Stream Before You Touch a Calculator
Every MBR sizing for HF etch waste fails or succeeds on the influent characterization, because fluoride spikes are batchy and tool-synchronized. Build the dataset around the parameters that actually drive the design: average and peak flow (peak factor 1.5–2.0×), total and free F⁻, Ca²⁺, Mg²⁺, Al³⁺, TSS, pH, temperature (etch tools typically run 25–40 °C), BOD₅, COD, NH₃-N, total P, and conductivity. Sample using one 24-h composite plus 8 grab samples spanning tool-on, steady-state, and tool-off cycles — HF etch lines batch-dump rinse water when a bath is refreshed and a composite alone will understate the peak F⁻ load. For F⁻, use ion chromatography (IC) rather than an ion-selective electrode, because Al³⁺ carryover from buffered oxide etches (BOE) complexes F⁻ and biases ISE readings low. Run ICP-OES for metals and a standard alkalinity titration to quantify carbonate competition with calcium dosing. The global MBR market grew from USD 0.25 billion in 2006 to USD 1.17 billion in 2010 (per the PMC review) — a useful one-line credibility anchor, not a market essay.
| Parameter | Typical range (HF etch rinse) | Analytical method | Why it drives design |
|---|---|---|---|
| Flow, average | 10–100 m³/day per line | Magmeter + totalizer | Sets tank volume and membrane area |
| Peak factor | 1.5–2.0× | Logged flow | Equalization and hydraulic surge |
| Free F⁻ | 50–1,500 mg/L | Ion chromatography | Sets Ca²⁺ stoichiometric dose |
| Ca²⁺, Mg²⁺, Al³⁺ | 0–200 mg/L each | ICP-OES | Complexes F⁻; raises real Ca²⁺ demand |
| BOD₅ / COD | 50–300 / 100–600 mg/L | BOD₅, dichromate COD | Sets F/M and aeration demand |
| NH₃-N | 10–50 mg/L | Distillation + titrimetry | Nitrification capacity at long SRT |
| Temperature | 25–40 °C | In-situ probe | Flux correction and HF gas-strip risk |
| pH | 1–9 (cyclic) | In-situ probe | HF gas evolution below pH 6.5 |
Pretreatment Train: Drop Fluoride Before the Bioreactor
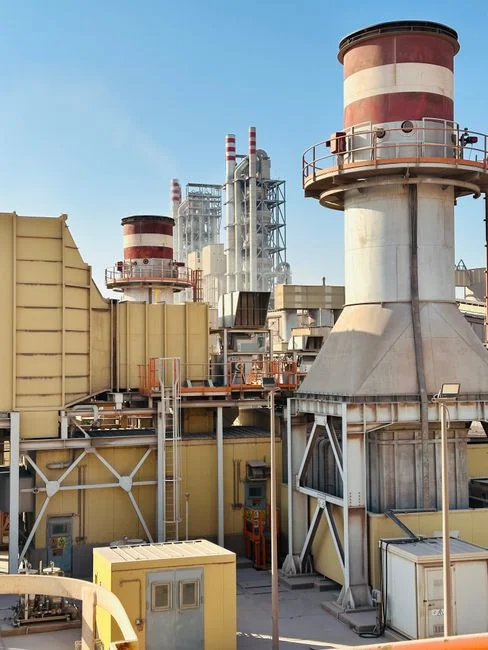
Calcium precipitation is the only unit operation that makes the downstream MBR biologically feasible. The reaction is Ca²⁺ + 2 F⁻ → CaF₂(s) with Ksp ≈ 1.46 × 10⁻¹⁰ at 25 °C, giving a theoretical residual of ~8–10 mg/L F⁻ at stoichiometric dose; real fab waste needs a 2.0–2.5× molar Ca²⁺:F⁻ ratio to overcome Al³⁺ and Mg²⁺ complexation. Three reagent options exist: lime (Ca(OH)₂) gives the highest residual alkalinity and lowest reagent cost but generates more sludge; CaCl₂ is cleaner and easier to automate on a PLC-controlled calcium chloride dosing skid, but adds chloride load — risky in fab wastewater where background Cl⁻ is already elevated. Decision logic: pick lime if the receiving drain tolerates Ca²⁺ hardness; pick CaCl₂ if the plant already co-treats with RO concentrate or other high-Cl streams. Run the reaction in an equalization tank with pH adjusted to 7.0–8.5 (avoid pH >9 because CaF₂ redissolves and HF reformation becomes a scrubber problem), rapid mix 1–2 min at G = 300–700 s⁻¹, then flocculation 15–20 min, then solids removal in a dissolved air flotation unit or lamella clarifier. Quantify the sludge at ~2.2 kg dry CaF₂ per kg F⁻ removed at stoichiometric dose, rising with overdosing; dewater on a plate-and-frame filter press to ~20% solids. Downstream of this stage, the MBR sees F⁻ ≤ 15–20 mg/L, which is biologically manageable. The literature clean-water flux for 0.1 μm PVDF is ~1,100 L/m²·h at 50 kPa (per the PMC review), but the etch stream forces the design flux down to 10–20 L/m²·h sustainable.
MBR Design Parameters for Fluoride-Treated Etch Waste
For a fab wastewater stream that has been through calcium precipitation, the MBR envelope narrows sharply. Hold HRT at 18–30 h, SRT at 30–60 days, MLVSS at 8,000–12,000 mg/L, F/M at 0.05–0.15 kg BOD/kg MLVSS·d, DO at 1.5–2.5 mg/L in the aerobic zone, and pH at 7.0–7.5 — never below 6.5 where HF gas can strip from solution and attack the membrane cassette. The long SRT is non-negotiable: at 30–60 days, biomass acclimates to residual F⁻ of 10–20 mg/L and nitrification recovers; below ~20 days SRT, nitrification collapses and the discharge envelope breaks. The membrane is 0.1 μm PVDF, submerged flat-sheet, designed at 10–20 L/m²·h — not the 1,100 L/m²·h initial flux at 50 kPa cited in the PMC review, which is a clean-water number, not a sustainable operating flux. Aeration is coarse-bubble scour at 0.3–0.5 Nm³ air per m³ permeate continuously, plus process air sized to BOD load plus endogenous respiration; intermittent scour causes rapid fouling on flat-sheet modules because particle deposition is not reversed between pulses. Install at least 2 membrane cassettes with isolation valves so one can be backwashed in place while the other runs at 80–100% design flux. Use a submerged PVDF module in an integrated MBR membrane bioreactor system rather than sidestream tubular: equipment footprint and energy intensity have fallen significantly versus first-generation units, which justifies the submerged choice. The DF-series PVDF flat-sheet MBR cassette is a defensible 2026 envelope for this stream.
| Parameter | 2026 design range for F⁻-treated etch waste | Basis |
|---|---|---|
| HRT | 18–30 h | Low organic load, long SRT stability |
| SRT | 30–60 days | F⁻-acclimated nitrification recovery |
| MLVSS | 8,000–12,000 mg/L | Submerged MBR envelope |
| F/M | 0.05–0.15 kg BOD/kg MLVSS·d | Low-load, long-SRT operation |
| DO (aerobic) | 1.5–2.5 mg/L | Nitrification + scour balance |
| pH | 7.0–7.5 (never < 6.5) | Avoid HF gas evolution |
| Design flux | 10–20 L/m²·h | Vs. ~1,100 L/m²·h clean-water at 50 kPa |
| Scour air | 0.3–0.5 Nm³/m³ permeate | Continuous, not intermittent |
Worked Sizing Example: 80 m³/day HF Etch Rinse
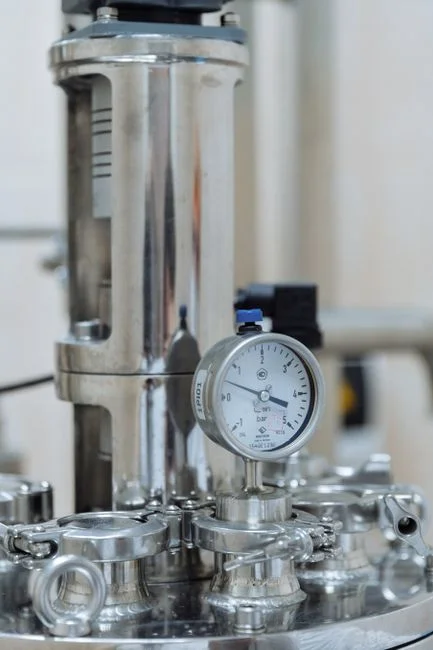
Inputs: Q = 80 m³/day average, peak factor 1.75× = 140 m³/day; F⁻ influent = 800 mg/L, target after precipitation = 15 mg/L; BOD₅ = 150 mg/L; NH₃-N = 30 mg/L. Calcium dose: (800 − 15) mg/L × 2.5 stoichiometric factor × (40/19) Ca:F molar mass ratio × 80 m³/day ≈ 3.3 kg Ca²⁺/day as CaCl₂ equivalent (practical commercial dose ≈ 14 kg CaCl₂/day, allowing for hydrate water and purity). Bioreactor volume: at HRT 24 h, V = 80 m³; aerobic fraction 70% gives anoxic 24 m³ plus aerobic 56 m³; at MLVSS 10,000 mg/L, F/M = (80 × 0.150 kg/m³) / (80 m³ × 10 kg/m³) = 0.15 kg BOD/kg MLVSS·d — at the top of the range and worth trimming the BOD₅ assumption with a real measurement. Membrane area: Q = 80,000 L/day ÷ 24 h = 3,333 L/h; at 15 L/m²·h, A = 222 m²; spec 4 × 80 m² DF-series cassettes to leave one redundant (per the DF-series envelope of 80–225 m², 32–135 m³/day per module). Air demand: process air ~0.15 Nm³/kg BOD removed + scour air 0.4 Nm³/m³ permeate → total ~720 Nm³/day; oversize the blower 30% for turndown and altitude. Waste sludge: biological ~0.05 kg TSS/kg BOD removed ≈ 0.6 kg TSS/day; chemical CaF₂ ~2.2 × (800−15) × 80 / 1,000,000 ≈ 0.14 kg/day dry basis, dewatered to ~20% solids on a plate-and-frame press. These numbers are reproducible by a peer reviewer and will survive a 2026 capex design review. For a parallel exercise on a different reject stream, see the worked example for sizing MBR for e-coat UF reject or the MBR sizing for paint booth curtain water guide.
Commissioning, Fouling Control, and Discharge Compliance
Acclimate the biomass deliberately: seed with 20–30% mixed liquor from an operating MBR, then step-feed F⁻ at 5 mg/L → 10 → 15 mg/L over 4–6 weeks while watching for the tell-tale failure mode — frothing, rising SVI, and NH₃-N breakthrough above 5 mg/L in the permeate. Set the cleaning regime on a timer: relax + backwash every 8–12 h with permeate, chemically enhanced backwash weekly (NaOCl 500 mg/L for 30 min), CIP with citric acid then NaOCl every 6–12 months when TMP rises above ~30 kPa. Instrument the MBR with online TMP, permeate turbidity (<1 NTU target), DO in the aerobic zone, pH, and periodic MLVSS via TSS — HF etch waste is unusually fouling-prone because residual Al(OH)₃ and SiO₂ colloids from BOE and Si-etch bath carryover accumulate on the membrane surface. The discharge envelope is F⁻ < 10 mg/L (typical China GB and EU limit), COD < 50 mg/L, NH₃-N < 5 mg/L, TSS < 10 mg/L; the MBR permeate already meets most reuse thresholds, and downstream RO polishing is only needed if the plant wants to recycle to UPW feed. The 2006→2010 USD 0.25B → 1.17B MBR market expansion (per the PMC review) is the right one-sentence market validation that this technology class is mature and that the engineering approach above is a 2026 default rather than an experimental build. If a parallel pretreatment issue arises — for example, a copper-bearing rinse that might benefit from a different upstream step — the methodology in electrocoagulation for copper removal complements, rather than replaces, the calcium precipitation described here.
Frequently Asked Questions
What free fluoride concentration can an MBR tolerate without nitrification collapse?
Acclimated biomass at 30–60 day SRT holds stable nitrification up to ~20 mg/L F⁻ in the bioreactor; unacclimated biomass loses nitrification at IC50 of 20–50 mg/L F⁻ (per the PMC review, 2023), which is why the calcium-pretreatment stage must drop F⁻ to ≤ 20 mg/L before the MBR.
What calcium dose is required to drop F⁻ from 800 mg/L to 15 mg/L on an 80 m³/day stream?
At a 2.5× stoichiometric Ca²⁺:F⁻ molar ratio, the stoichiometric Ca²⁺ demand is ~3.3 kg/day, equivalent to roughly 14 kg/day of commercial CaCl₂ — verifiable in the worked sizing example above and scalable linearly with flow.
Why is the design flux for an HF-etch MBR only 10–20 L/m²·h when PVDF membranes rate 1,100 L/m²·h clean-water?
The 1,100 L/m²·h at 50 kPa figure (per the PMC review) is a clean-water initial flux measured on a new module under laboratory TMP. Real etch wastewater carries Al(OH)₃ and SiO₂ colloids that foul the flat sheet within days, so the sustainable operating flux — the number that actually sizes membrane area — is 10–20 L/m²·h, two orders of magnitude lower.