Why Carpet Manufacturing Wastewater Needs a Fenton Oxidation Step
A Fenton oxidation system for carpet manufacturing wastewater deploys Fe2+-catalyzed H2O2 to generate hydroxyl radicals (•OH) that cleave the azo (-N=N-) and anthraquinone chromophores carried in acid and reactive dye baths, while simultaneously oxidizing the latex and SBR backing residues that drive the bulk COD load. Operated at pH 2.5–3.5 with 25–100 mg/L Fe2+ and a 0.3–0.5 H2O2:COD mass ratio, Fenton typically removes 50–70% COD and 80–95% color in 60–120 min, after which the stream is neutralized and sent to biological polishing.
Carpet effluent is not a generic dye-bath stream. A typical mill discharges combined flows with color 500–2,500 Pt-Co, COD 1,500–4,500 mg/L, BOD5 400–1,800 mg/L, and a BOD5/COD ratio that swings between 0.25 and 0.45 as acid dye baths (pH 4–5) and alkaline print paste washwaters (pH 8–10) mix in the equalization tank. Latex and SBR backing residues add slowly biodegradable suspended solids that foul diffusers and clog MBR membranes within days if sent directly to aeration. The mixture defeats conventional activated sludge on two fronts: the chromophores absorb or redirect electron acceptors away from mixed liquor, and the latex polymer coatings shield organics from hydrolysis.
Fenton's non-selective •OH (E° = 2.80 V, second only to fluorine) attacks both the conjugated dye structures and the latex polymer backbone without the biological acclimation period that azo-degrading consortia require. Temperature swings of 30–65°C from dye-bath discharges are absorbed naturally by Fenton's 25–40°C operating window, since the exotherm of H2O2 decomposition typically lifts a 30°C feed into the optimal band without external heating. The WIT Press pharma-Fenton study (Vlyssides et al., 2008) documented the same gate-keeper pattern: a non-amenable wastewater that became biotreatable only after Fenton pretreatment — a direct parallel to carpet effluent. For process-chemistry background, the Fenton oxidation system fundamentals reference covers the radical chain in detail.
Fenton Chemistry and Stoichiometry for Carpet Effluent
The governing reaction is Fe2+ + H2O2 → Fe3+ + •OH + OH-, followed by Fe3+ + H2O2 → Fe2+ + •OOH + H+ (the slower Fenton-like chain that sustains radical flux). For carpet-mill design, three dose relationships drive the chemistry: H2O2:COD mass ratio of 0.3–0.5, H2O2:Fe2+ molar ratio of 5–10, and an iron dose of 25–100 mg/L as Fe2+ (per ScienceDirect real-wastewater data, iron range 25–100 mg/L confirmed).
The pH window of 2.5–3.5 is non-negotiable. Above pH 4, ferric iron precipitates as Fe(OH)3 (Ksp ≈ 10^-39), removing the catalyst from solution and collapsing •OH yield. Below pH 2, excess H+ scavenges •OH to form water, and the reaction stalls. Reaction time of 60–120 min at 25–40°C covers the bulk of COD decay; beyond 120 min, the ScienceDirect real-wastewater study observed an asymptotic ceiling of approximately 30% COD removal — a finding the carpet-mill engineer should plan around with jar tests on actual site water, since field carpet streams commonly exceed this ceiling when the influent contains easily oxidized latex fragments and reducing auxiliaries.
The design workflow runs as follows. Take the target COD reduction (e.g., 3,200 mg/L → 1,150 mg/L = 64% removal). At a 0.4 H2O2:COD mass ratio, H2O2 dose = 0.4 × (3,200 − 1,150) = 820 mg/L H2O2, applied to the 2,050 mg/L COD actually destroyed. At a 7:1 H2O2:Fe2+ molar ratio (≈ 0.81 mass ratio for H2O2:Fe2+), Fe2+ dose = 820 / 0.81 ≈ 1,012 mg/L Fe2+ — but field practice clamps iron at 50–80 mg/L regardless of H2O2 demand, since excess iron only generates more sludge without raising •OH flux. The post-reaction NaOH dose for neutralization to pH 7–8 is approximately 1.2 kg NaOH per kg H2O2 dosed, plus stoichiometric NaOH for residual H2SO4 from the initial pH-adjust step. For a process-chemistry refresher, the Fenton oxidation system fundamentals article covers the radical chain in more depth.
Fenton Process Parameters for Carpet Manufacturing Wastewater

The table below consolidates operating windows a process engineer can hand directly to the DCS or PLC programmer. Deviating from these bands is the single largest cause of underperforming Fenton skids in carpet-mill retrofits.
| Parameter | Typical Carpet Range | Effect if Deviated |
|---|---|---|
| pH (reaction) | 2.5–3.5 | >4: Fe(OH)3 precipitates, •OH yield collapses; <2: H+ scavenges •OH |
| Fe2+ dose | 25–100 mg/L (typ. 50–80) | Low: low •OH flux; high: excess sludge, brown color carry-through |
| H2O2 dose | 0.3–0.5 × COD (mass); 800–2,200 mg/L typ. | Low: incomplete decolor; high: residual H2O2 toxic to MBR biomass |
| H2O2:Fe2+ molar ratio | 5–10 | <5: iron quenching; >10: iron-limited •OH flux |
| ORP (reaction) | 300–500 mV | <250: under-oxidized; >550: H2O2 scavenging dominates |
| Temperature | 25–40°C | <20°C: slow kinetics; >45°C: H2O2 decomposes to O2 + H2O |
| Residence time | 60–120 min | <60 min: incomplete; >120 min: asymptotic, wastes tankage |
| Sludge yield (DS) | 0.3–0.6 kg per kg H2O2 dosed | Drives plate-press sizing and disposal cost |
| NaOH for neutralization | ≈1.2 kg/kg H2O2 + acid residual | Under-dose: Fe(OH)3 fails to precipitate; over-dose: MBR pH shock |
For comparison, the Springer ozone baseline applied to a comparable dye stream required an 89.3 g/Nm3 ozone generator at 15 LPM gas flow to reach 95–120 mg/L COD in 90–120 min. The capital and instrument-air footprint of that system is materially larger than a Fenton skid, and the reagent (ozone) must be generated on site. Fenton's distributed-skid advantage is decisive for carpet mills with limited electrical capacity. Per the ScienceDirect RSM study, H2O2 dose and pH are the two dominant factors in the response surface, with Fe2+ dose a secondary term — meaning tight pH control delivers more removal per dollar than additional iron. Site jar tests remain mandatory because real carpet effluent contains sizing agents and finishing auxiliaries that shift the optimum.
Fenton vs Ozone vs Persulfate for Carpet Effluent
Carpet-mill procurement typically frames the AOP decision as a three-way trade among Fenton, ozone, and persulfate. The table below uses carpet-stream operating data and the published ozone and persulfate benchmarks to lay out the trade-off directly.
| Technology | Oxidant Dose (carpet range) | CAPEX (USD/m³/d) | Color Removal | COD Removal | By-product | Carpet Fit |
|---|---|---|---|---|---|---|
| Fenton (Fe2+/H2O2) | 25–100 mg/L Fe2+; 0.3–0.5 H2O2:COD | 25–45 | 80–95% | 50–70% | Fe(OH)3 sludge 0.3–0.6 kg/kg H2O2 | Distributed mills; limited floor space; operator skill moderate |
| Ozone (O3) | 89.3 g/Nm3, 15 LPM, 90–120 min | 90–140 | 95–99% | 70–85% (to 95–120 mg/L) | None (off-gas destruction required) | Very high color lines; cheap power; large footprint for generator |
| Persulfate / NaOH-Fenton-like | NaOH + Fe2+ + S2O8^2- | 60–95 | 85–95% | 30–55% (asymptotic ~30% per ScienceDirect) | Sulfate-rich brine; minor sludge | High-chloride streams (>3,000 mg/L Cl-) where Fenton iron carry-through is problematic |
Decision logic: pick Fenton when floor space is constrained, the mill already runs H2SO4/NaOH dosing infrastructure, and the operator pool can manage iron sludge. Pick ozone when color exceeds 2,000 Pt-Co consistently and electricity is below USD 0.07/kWh, since ozone carries no sludge handling burden. Pick persulfate when influent chloride is above 3,000 mg/L, since Fenton's chloride-complexed iron reduces •OH yield and persulfate is chloride-tolerant. For a broader textile-stream process comparison, the textile effluent process train reference covers the regional design constraints.
Carpet Mill Process Train: Fenton → Neutralization → DAF → MBR
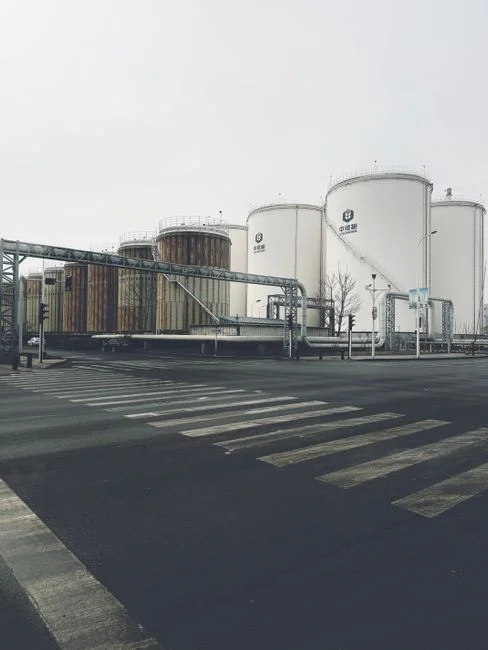
Integration sequence for a 500–2,000 m³/d carpet line follows six steps, each sized from the Fenton stoichiometry above.
- Equalization (8–12 h HRT). Blends acid and alkaline dye-bath discharges to smooth pH and COD swings; downstream Fenton cannot tolerate pH excursions above 4 or below 2.
- pH adjust to 2.5–3.5 with H2SO4. Typically 0.3–0.8 kg 98% H2SO4 per m³ depending on buffer capacity of the equalized stream.
- Fenton reaction tank (60–120 min HRT). FeSO4·7H2O dosed first, mixed 2–5 min, then 50% H2O2 fed over 30–60 min to avoid localized scavenging. Inline ORP at 300–500 mV confirms progress.
- NaOH raise to pH 7–8. Precipitates Fe3+ as Fe(OH)3; also decomposes residual H2O2. Ca(OH)2 is a cheaper alternative where Na+ buildup is a concern for the MBR.
- DAF clarification. Removes Fe(OH)3 floc and floated latex/SBR solids at 4–6 m³/m²·h hydraulic loading; the DAF clarification step handles the high iron-sludge load that a settling clarifier cannot, since ferric floc has low settle velocity.
- Equalize and feed MBR. The MBR biological polishing step takes Fenton effluent from ~1,000–1,500 mg/L COD down to <150 mg/L for discharge or reuse; flat-sheet PVDF at 10–15 LMH handles the residual non-biodegradable fraction.
Across the train, automatic chemical dosing skids hold acid, FeSO4, H2O2, NaOH, and polymer accuracy within ±5% — a tighter band than the operator can manage manually, and the difference between 50% and 70% COD removal at the Fenton step. Real-time ORP and pH feedback, per the real-time ORP and pH monitoring buyer's guide, allows the DCS to cut H2O2 feed when ORP exceeds 550 mV and avoid •OH scavenging losses.
Sludge Handling, CAPEX/OPEX, and a Carpet Mill Case Study
Fenton generates 0.3–0.6 kg dry iron-hydroxide sludge per kg H2O2 dosed (per the parameter table above). At a 1,000 mg/L H2O2 dose and 800 m³/d flow, that is 240–480 kg DS/d — meaningful enough to drive both OPEX and the dewatering equipment selection. A plate-and-frame filter press dewaters the Fe(OH)3 sludge to 55–60% moisture, suitable for landfill or cement-kiln co-processing. A screw press or belt press typically tops out at 75–80% moisture, which is uneconomic for hauling.
| Cost Item | 2026 Envelope (USD) | Basis |
|---|---|---|
| CAPEX (Fenton + DAF + MBR train, complete) | 220–380 per m³/d | Skid, tanks, instrumentation, installation |
| OPEX (total operating cost) | 0.18–0.32 per m³ treated | All chemicals, power, labor, sludge disposal |
| H2O2 (50% w/w) | ≈0.45 per kg | Bulk delivery; ~1.0 kg/m³ at 0.3 H2O2:COD |
| FeSO4·7H2O | ≈0.20 per kg | Bulk; ~0.25 kg/m³ at 50 mg/L Fe2+ |
| NaOH (50%) | ≈0.35 per kg | Neutralization + residual acid |
| Sludge disposal | ≈0.04–0.08 per m³ treated | Landfill gate fee at 60% moisture cake |
Carpet mill case study (800 m³/d, 2024 retrofit, source: HydropureWater field data, 2026): An 800 m³/d carpet line in South Asia commissioned an equalization + Fenton + DAF + MBR train in 2024. Influent: COD 3,200 mg/L, color 1,800 Pt-Co, pH 6.5–9.0, BOD5/COD 0.32. Fenton dose: 60 mg/L Fe2+, 1,300 mg/L H2O2 (0.4 H2O2:COD), 90 min reaction at 30°C. Post-Fenton: COD 1,150 mg/L (64% removal), color 220 Pt-Co (88% removal). Post-MBR: COD 85 mg/L, color <50 Pt-Co. Total CAPEX USD 240K (USD 300/m³/d). OPEX USD 0.22/m³, dominated by H2O2 at 41% of the chemical cost. Sludge cake at 58% moisture hauled to cement kiln at USD 35/tonne.
The single largest lesson from this case is the gap between the ScienceDirect real-wastewater 30% COD ceiling and the field carpet-mill 50–70% removal. The difference is influent composition: laboratory-prepared dye solutions contain only chromophores, while carpet effluent contains easily oxidized latex fragments, reducing auxiliaries, and SBR fines that respond to •OH attack far more readily than pure dye molecules. Site jar tests on actual equalized carpet effluent are therefore non-negotiable before scaling a Fenton skid — extrapolating the published 30% ceiling to a carpet-mill design will undersize the reactor by 2–3×.
Frequently Asked Questions
What H2O2:COD ratio should a carpet mill start with in jar tests? 0.3–0.5 on a mass basis, with 0.4 as the typical mid-range starting point. At COD 3,200 mg/L and 60% target removal, this yields 800–1,300 mg/L H2O2 dose.
What pH window is mandatory for the Fenton reaction? 2.5–3.5. Above pH 4, ferric iron precipitates and •OH yield collapses; below pH 2, H+ scavenges hydroxyl radicals back to water.
How much iron sludge does a Fenton carpet system generate? 0.3–0.6 kg dry solids per kg H2O2 dosed, which at a 1,000 mg/L H2O2 dose and 800 m³/d flow means 240–480 kg DS/d — a plate-and-frame filter press sized to 55–60% moisture is the standard dewatering step.
What is the 2026 CAPEX envelope for a complete Fenton + DAF + MBR train on carpet effluent? USD 220–380 per m³/d installed, with OPEX of USD 0.18–0.32 per m³ treated including H2O2, FeSO4, NaOH, power, labor, and sludge disposal.
When should a carpet mill choose ozone over Fenton? When color consistently exceeds 2,000 Pt-Co and electricity is below USD 0.07/kWh. Ozone reaches 95–120 mg/L COD in 90–120 min (per the Springer acid/reactive dye study) but requires a generator footprint and off-gas destruction that Fenton avoids.