Why Steel Mill Wastewater Breaks Generic RO Cost Models
Commercial RO pricing guides for 2026 quote $2,000–$80,000 for systems up to 10,000 GPD (≈38 m³/h), scaling to $100,000–$300,000 at 50,000–100,000 GPD (≈190–380 m³/h) and over $1 million at 500,000 GPD (≈1,900 m³/h) (per AMPAC USA, 2026-03). Those numbers assume soft, low-TDS feedwater — typically <500 mg/L TDS, negligible metals, and FOG under 10 mg/L. A high-turbidity wastewater treatment design built for steel-mill influent breaks every one of those envelope assumptions.
Steel-mill effluent routinely carries TDS of 3,000–15,000 mg/L, total hardness of 800–2,500 mg/L as CaCO₃, oil and grease of 50–500 mg/L, COD of 200–1,200 mg/L, and dissolved heavy metals — chromium, nickel, zinc, lead — at mg/L levels (HydropureWater field data, 2026). Each contaminant class forces a dedicated pretreatment unit that the generic guides do not price. Hardness drives softening or weak-acid cation; free metals force pH adjustment and precipitation; FOG demands DAF; silica caps recovery to suppress CaSO₄ scaling on the membrane. The result is a 25–40% pretreatment cost adder on top of skid CAPEX, recovery capped at 70–80% versus 85% in light industrial, and a real 2026 CAPEX band of $180,000–$1.5 million for 50–500 m³/h.
Steel Mill Wastewater Influent Parameters and RO Design Envelope
Influent characterization is the first procurement deliverable — no defensible RO quote exists without a 30-day composite sampling campaign. The table below shows typical ranges for coking, rolling, and pickling streams, cross-referenced against the three regulatory wedges that govern discharge or reuse.
| Parameter | Coking wastewater | Rolling mill | Pickling line | RO feed target |
|---|---|---|---|---|
| pH | 6.5–9.0 | 6.0–8.5 | 1.0–4.0 | 6.5–7.5 |
| TDS (mg/L) | 3,000–8,000 | 1,500–5,000 | 5,000–15,000 | — |
| Conductivity (µS/cm) | 4,500–12,000 | 2,200–7,500 | 8,000–22,000 | — |
| Total hardness (mg/L CaCO₃) | 800–1,800 | 600–1,500 | 1,000–2,500 | <50 (with softening) |
| Chloride (mg/L) | 800–2,500 | 200–800 | 2,000–6,000 | — |
| Sulfate (mg/L) | 400–1,500 | 150–600 | 500–2,000 | — |
| Silica (mg/L SiO₂) | 20–60 | 10–40 | 15–50 | <30 (with antiscalant) |
| FOG (mg/L) | 50–300 | 100–500 | 20–150 | <5 (post-DAF) |
| COD (mg/L) | 800–1,200 | 200–600 | 400–900 | — |
| TSS (mg/L) | 100–400 | 50–200 | 30–150 | <1 (post-MMF) |
| Total Cr (mg/L) | 0.5–5 | 0.1–1 | 2–50 | <0.1 |
| Cr(VI) (mg/L) | 0.1–1 | <0.1 | 0.5–20 | <0.05 |
| Ni (mg/L) | 0.2–2 | 0.1–0.5 | 1–10 | <0.1 |
| Zn (mg/L) | 0.5–3 | 0.2–1 | 1–15 | <0.2 |
Three regulatory limits define the design wedge. China GB 8978-1996 sets Cr(VI) at 0.5 mg/L, Ni at 1.0 mg/L, and Zn at 5.0 mg/L for first-class discharge. The EU Industrial Emissions Directive 2010/75/EU BAT-AELs cap total Cr at 0.2–0.5 mg/L and Ni at 0.2–0.3 mg/L depending on the BAT conclusion. India CPCB Schedule VI sets Cr(VI) at 0.1 mg/L, total Cr at 2.0 mg/L, and Ni at 3.0 mg/L for inland discharge. RO permeate must hit process-water conductivity under 200 µS/cm for coking and rolling reuse.
RO feed-quality requirements — SDI₁₅ ≤ 3 and LSI < 0 — are not optional. Pickling-line and coking streams routinely exceed SDI 6–8 without polishing, which means a multi-media filter for SDI reduction sits in front of every RO skid. Recovery-rate math is unforgiving: at 75% recovery with 10,000 mg/L TDS feed, the concentrate reaches ~40,000 mg/L, sitting just below CaSO₄ saturation (Ksp ~2.4 g/L as CaSO₄) — leaving no margin for temperature swings or antiscalant underfeed.
Pretreatment Train That Actually Protects the RO Membrane
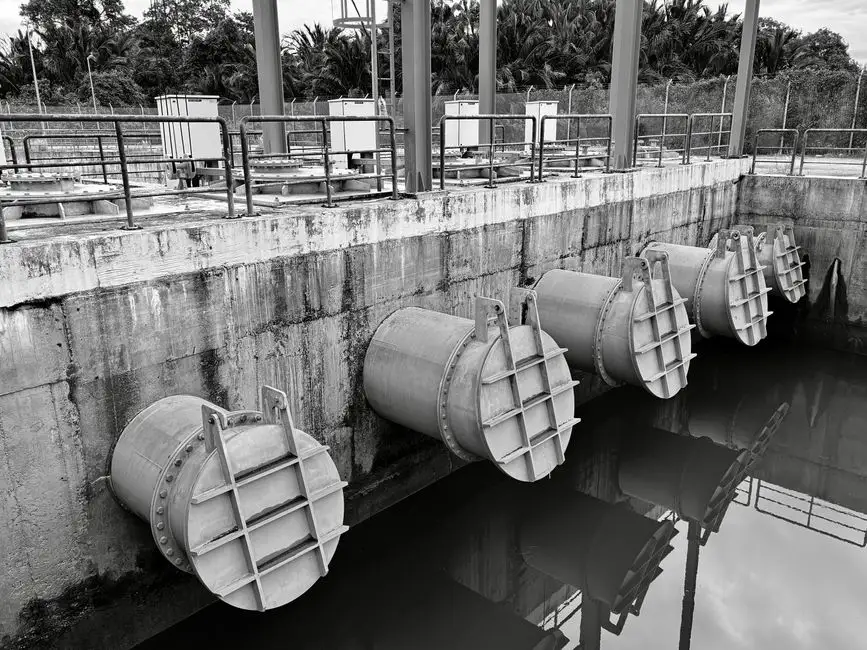
Pretreatment is 25–40% of total CAPEX on a steel-mill RO project, not the 5–10% adder that commercial guides imply. The train runs in five stages, each justified by a specific influent failure mode.
Stage 1 — DAF oil and grease removal. A DAF oil and grease removal unit cuts FOG from 50–500 mg/L to under 10 mg/L at 85–95% removal efficiency. Hydraulic residence time runs 20–30 minutes; air-to-solids ratio sits at 0.005–0.015. Air-saturated recycle is 20–40% of forward flow. Skid CAPEX scales from $25,000 at 50 m³/h to $90,000 at 500 m³/h.
Stage 2 — pH adjustment and metal precipitation. Lime plus NaOH raises pH to 8.5–9.5, precipitating Ni, Zn, and trivalent Cr as hydroxides. Cr(VI) is reduced to Cr(III) with FeSO₄ or Na₂S at pH 2.0–2.5, then re-precipitated. Residual metals are pushed below RO feed tolerance (Cr <0.1, Ni <0.1, Zn <0.2 mg/L). Lime consumption runs 1.5–3.0 kg per m³ of feed on pickling-line water.
Stage 3 — hardness reduction. Lime/soda softening or weak-acid cation (WAC) units drop hardness from 1,000–2,500 mg/L to under 50 mg/L. WAC regeneration uses 100–150 g NaCl per liter of resin at $0.02–$0.05 per liter of resin treated. Soda ash addition runs 0.8–1.5 kg per m³ on high-sulfate pickling streams.
Stage 4 — multi-media filtration. Anthracite, sand, and garnet layers drive SDI₁₅ under 3 and remove residual TSS to under 1 mg/L. Stage 5 activated carbon strips free chlorine and residual organics that would oxidize polyamide membranes. An automatic antiscalant and CIP dosing skid injects phosphate-free antiscalant at 1–5 mg/L, sized at $800–$3,000 per skid (per AMPAC 2026 generic adder).
RO Skid Sizing, Membrane Selection, and Steel-Mill CAPEX
Capacity tiers map to facility scale: 50 m³/h covers a small rolling-mill reuse loop; 100 m³/h suits a coking-plus-rolling combined plant; 250 m³/h serves an integrated steelworks; 500 m³/h supports large integrated mills or cluster reuse networks shared across facilities. The table below translates capacity into equipment cost so finance can lock a budget figure against a single reference.
| Capacity (m³/h) | Capacity (GPD) | CAPEX range (USD, FOB China 2026) | Membrane count | Pressure vessels |
|---|---|---|---|---|
| 50 | 317,000 | $180,000–$280,000 | 12–18 elements | 3 × 4-port 8" |
| 100 | 634,000 | $320,000–$480,000 | 24–36 elements | 6 × 4-port 8" |
| 250 | 1,585,000 | $650,000–$950,000 | 60–90 elements | 15 × 4-port 8" |
| 500 | 3,170,000 | $1,100,000–$1,500,000 | 120–180 elements | 30 × 4-port 8" |
These figures bracket AMPAC's 2026 industrial range of $100,000–$300,000 at 50,000–100,000 GPD (≈190–380 m³/h) and over $1 million at 500,000 GPD (≈1,900 m³/h), with the steel-mill adder reflecting heavier pretreatment and high-rejection membrane specification (per AMPAC USA, 2026-03).
Membrane selection follows influent TDS. For feed under 8,000 mg/L, standard BWRO elements such as DOW BW30-400 or Toray TM720 deliver 99.5% nominal rejection at 10–15 bar. For 8,000–15,000 mg/L feeds, high-rejection BWRO with low-fouling feed spacers (28–34 mil) is required to keep differential pressure manageable. FRP 8-inch pressure vessels in 4-port or 6-port configuration carry the array. The high-pressure pump runs 12–20 bar for BWRO, and an energy recovery device (ERD) — isobaric PX or turbocharger — cuts specific energy 30–35% on systems above 100 m³/h, dropping electricity draw toward 3.5–4.5 kWh/m³.
Line items outside the membrane array add up: PLC controls with HMI, CIP system (two tanks, 2–5 m³ each, heated to 35 °C), instrument air at 6–8 bar, and a chemical-cleaning skid with citric acid, NaOH, and Na-EDTA dosing. An industrial RO skid for steel-mill reuse typically bundles these into a single engineered package.
OPEX Breakdown: Energy, Chemicals, Membranes, Labor, and Brine
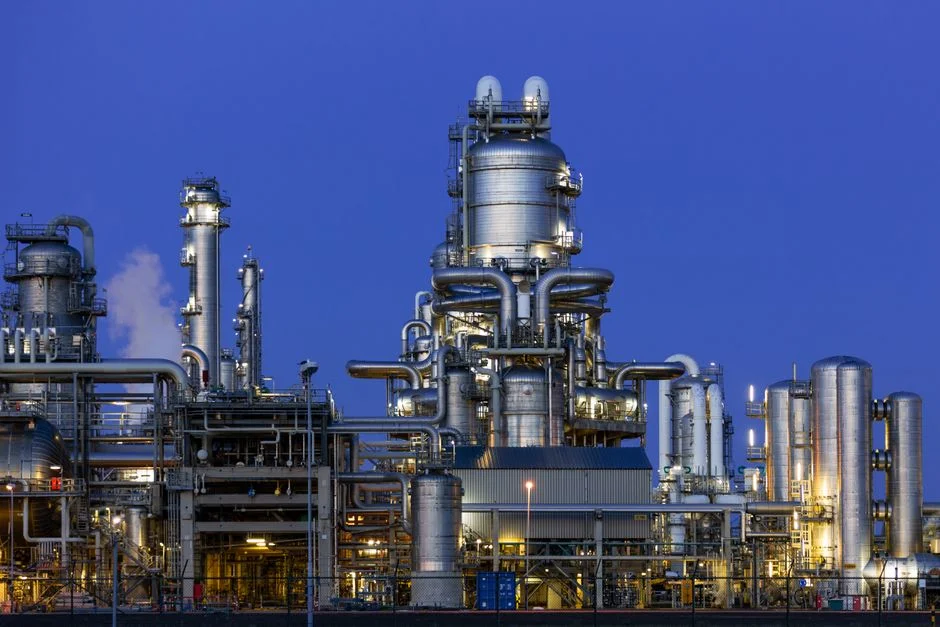
Energy is the largest variable line item. Steel-mill RO runs 4–6 kWh/m³ at $0.06–$0.10/kWh, landing at $0.24–$0.60/m³. The commercial benchmark is 3–6 kWh per 1,000 gallons (0.8–1.6 kWh/m³) for soft feedwater; the steel multiplier of 3–4× reflects higher feed pressure, higher fouling loading, and the energy penalty of running recovery below the membrane's optimum. Antiscalant dosing adds $0.005–$0.015/m³; CIP chemicals (citric acid for CaCO₃ scale, NaOH for biological and silica fouling, Na-EDTA for metal oxides) run $0.01–$0.03/m³ when amortized over the 4–6 week cleaning interval.
Lime and soda-ash regeneration for the softening step lands at $0.02–$0.06/m³ of permeate. Membrane replacement is the budget line that surprises most steel-mill procurement teams: BWRO elements survive 3–5 years in light industrial, but heavy-metal precipitation carryover, oil breakthrough events, and CaSO₄ excursions compress replacement cycles to 18–30 months in steel service. At $600–$1,200 per element and 60–180 elements per system, annualized membrane cost is $0.04–$0.09/m³. Labor runs 0.5–1.5 FTE per system at $40,000–$80,000 fully loaded annually.
Concentrate disposal is the variable that swings the total. Reuse-only projects with on-site evaporation or surface discharge under permit land at $0.30–$0.60/m³ of concentrate. Projects that route concentrate to a brine polisher or ZLD/MVR crystallizer see brine-handling cost rise to $0.85–$1.80/m³ of total treated water, depending on TDS. Total OPEX therefore splits into two bands: $0.18–$0.62/m³ for reuse-only configurations and $0.85–$1.80/m³ with ZLD brine polishing.
Five-Year TCO, ZLD Integration, and Buyer's Checklist
The 5-year TCO is the number that gets the project approved or killed. The table below applies a 2.2–2.8× multiplier to first-cost, anchored against AMPAC's 2–3× industry benchmark (per AMPAC USA, 2026-03).
| Capacity (m³/h) | Year-0 CAPEX | 5-year OPEX (reuse-only) | 5-year TCO (reuse-only) | 5-year TCO (with ZLD) |
|---|---|---|---|---|
| 50 | $180K–$280K | $400K–$640K | $580K–$920K | $1.3M–$2.0M |
| 100 | $320K–$480K | $700K–$1.1M | $1.0M–$1.6M | $2.2M–$3.4M |
| 250 | $650K–$950K | $1.4M–$2.4M | $2.1M–$3.4M | $4.5M–$7.0M |
| 500 | $1.1M–$1.5M | $2.5M–$4.0M | $3.6M–$5.5M | $7.5M–$12M |
Add ZLD when concentrate volume exceeds 20% of feed, concentrate TDS exceeds 50,000 mg/L, or site water-stress rules force closed-loop operation. Combined RO plus MVR/crystallizer CAPEX runs $2.5M–$8M for 100–250 m³/h systems, with MVR thermal energy at 55–70 kWh/m³ of distillate. The compliance wedge sits across three regimes: GB 8978-1996 for Chinese mills, EU IED 2010/75/EU BAT-AELs for European producers, and India CPCB Schedule VI for Indian operations — see the global chemical wastewater discharge standards reference for full limit values. Sludge handling downstream of pretreatment ties into the filter press operating cost for steel-mill sludge.
Procurement checklist before signing: (1) a 30-day influent composite across all shift patterns, not grab samples; (2) an 8–12 week on-site pilot with the proposed membrane and antiscalant, including two CIP cycles; (3) membrane pro-rata warranty of 3 years, skid warranty of 12 months; (4) spare-parts kit covering 1× set of elements, 2× sets of cartridge filters, and 1× high-pressure pump seal kit; (5) local service footprint within 8 hours' drive; (6) reference list of at least two operating steel-mill installations at ≥80% of the proposed capacity.
Frequently Asked Questions
What is the 2026 CAPEX for an RO system treating steel mill wastewater? A 50–500 m³/h RO system for steel-mill wastewater costs $180,000–$1.5 million in 2026, with pretreatment adding 25–40% to skid cost. The wide band reflects influent TDS (3,000–15,000 mg/L), heavy-metal load, and the reuse-versus-ZLD decision (HydropureWater field data, 2026).
What does steel-mill RO cost per cubic meter of treated water? OPEX lands at $0.18–$0.62/m³ for reuse-only operation and $0.85–$1.80/m³ when concentrate is routed to ZLD or MVR brine polishing. Energy alone runs $0.24–$0.60/m³ at 4–6 kWh/m³ and $0.06–$0.10/kWh (per AMPAC USA, 2026-03).
When does a steel-mill RO project require ZLD integration? ZLD becomes mandatory when concentrate volume exceeds 20% of feed, concentrate TDS exceeds 50,000 mg/L, or local water-stress rules force closed-loop discharge. Combined RO plus MVR CAPEX runs $2.5M–$8M for 100–250 m³/h systems.
How long do RO membranes last in steel-mill service? BWRO elements last 18–30 months in steel-mill service versus 3–5 years in light industrial duty, because heavy-metal carryover, oil breakthrough, and CaSO₄ scaling accelerate fouling. Annualized membrane cost runs $0.04–$0.09/m³ of permeate.
Which discharge regulations govern a steel-mill RO project in 2026? China GB 8978-1996 caps Cr(VI) at 0.5 mg/L, Ni at 1.0 mg/L, Zn at 5.0 mg/L. EU IED 2010/75/EU BAT-AELs set total Cr at 0.2–0.5 mg/L and Ni at 0.2–0.3 mg/L. India CPCB Schedule VI sets Cr(VI) at 0.1 mg/L, total Cr at 2.0 mg/L, Ni at 3.0 mg/L.