What Actually Drives Fenton Oxidation Operating Cost
Fenton oxidation operating cost in 2026 typically falls between $0.18 and $0.85 per cubic meter of treated wastewater, with hydrogen peroxide (H2O2) and ferrous sulfate (FeSO4) together absorbing 55–70% of OPEX; iron-rich sludge dewatering, pH-correction caustic, and aeration energy make up the remaining 30–45% (HydropureWater procurement benchmarks, 2026). Classical Fenton chemistry is Fe²⁺ + H2O2 → •OH + Fe³⁺ + OH⁻, and the hydroxyl radical only generates fast enough when the reactor sits inside a tight pH 2.5–3.5 window — outside that band, iron precipitates as ferric hydroxide and •OH yield collapses (Badawy & Ali, 2006; pH optimum replicated across peer-reviewed studies since). That narrow window is the single biggest reason Fenton has two reagents on the cost line, not one: you dose acid in, run the reaction, then dose base back out.
Splitting OPEX into four buckets gives procurement a defensible model. Reagents sit at 55–70% of the bill — H2O2, FeSO4, plus acid/base for the pH swing. Iron sludge handling runs 10–20% and is the line item junior engineers routinely miss. pH correction chemicals (H2SO4 in, NaOH out) are 8–15%. Energy plus labor is the remaining 10–20%. The model is dominated not by flow rate but by influent COD loading and the H2O2:Fe²⁺ molar ratio you operate at, which typically lands between 1:1 and 10:1. A 2024 study of composite industrial wastewater reported $3.117 per batch for classical Fenton and $2.063 for electro-Fenton at the same removal target — a 34% gap driven almost entirely by sludge and reagent consumption (Pre-treatment of composite industrial wastewater, Scientific Reports, 2024). A separate biomass-condensate pretreatment study put Fenton at €2.17/kg COD eliminated (US$8.7/kg COD at 2024 FX), which sits at the high end because of the refractory matrix — useful as an upper-bound anchor when sizing a CAPEX business case.
Reagent Unit Costs and Stoichiometric Dosage (2026)
Reagent pricing in 2026 is volatile enough that any OPEX model older than six months is already a planning risk. The table below consolidates 2026 industrial procurement benchmarks for the four reagents that drive Fenton OPEX, with regional adjustment notes.
| Reagent | 2026 USD price range | Typical dose | Notes |
|---|---|---|---|
| Hydrogen peroxide, 50% w/w | $0.55–$1.20/kg | 0.3–3.0 g H2O2 per g COD removed | Bulk (≥50 t/y) typically 15–25% below drum; Asia-Pacific spot below $0.70/kg |
| Ferrous sulfate heptahydrate (FeSO4·7H2O) | $0.18–$0.35/kg | 0.05–0.5 g Fe²⁺ per g COD | Trash-grade / agriculture-grade cuts 30–40% in non-strict applications |
| Sulfuric acid, 98% | $0.10–$0.25/kg | 0.3–0.8 kg/m³ for high-alkalinity streams | Skip entirely if influent alkalinity <200 mg/L as CaCO3 and native pH <4.5 |
| Sodium hydroxide, 50% liquid | $0.35–$0.65/kg | 0.5–1.5 kg/m³ for neutralization to pH 6–9 | Often 1.5–2× the acid dose on a $/m³ basis — this is the hidden second chemical |
The stoichiometric walk-through is what turns the price table into a budget number. Take an influent of 1,000 mg/L COD, target 80% removal, 1 m³ basis. That is 800 g COD destroyed. At 3.0 g H2O2 per g COD removed (the upper-middle of the dosing range), you need 2.4 kg of 50% H2O2 per m³. At 0.75 g Fe²⁺ per g COD removed, you need 0.6 kg FeSO4·7H2O per m³. At mid-range unit prices, the reagent bill alone is 2.4 × $0.85 + 0.6 × $0.26 = $2.20/m³ — and that is before acid, base, sludge, energy, or labor. Halve the H2O2 dose to 1.5 g/g COD (achievable when the matrix is biodegradable rather than refractory) and the reagent line falls to about $1.16/m³. This is why jar-testing the actual H2O2:Fe²⁺ ratio on your stream is the highest-leverage procurement activity in the entire Fenton project — every 0.5 g/g reduction in H2O2 dose is roughly $0.40/m³ back to OPEX at 2026 prices.
Iron Sludge, pH Correction, and Energy: The Hidden Cost Layers
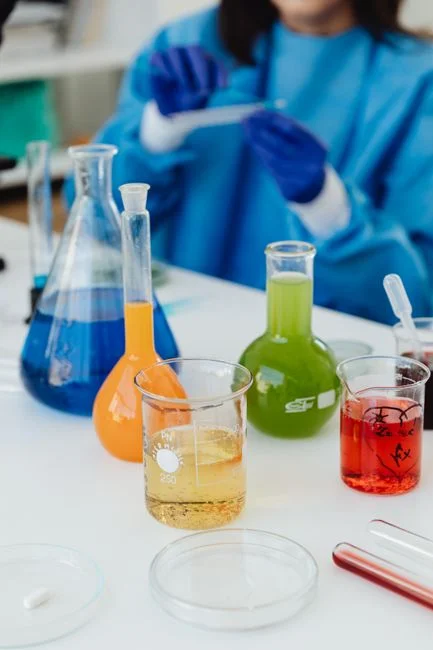
The three line items below are where a greenfield Fenton budget drifts 15–30% over the original PO in year one, because they are usually estimated from a single data point and not stress-tested.
Iron sludge. Every kg of Fe²⁺ dosed becomes 1.5–3.0 kg of dry iron hydroxide sludge once pH is corrected to discharge range (HydropureWater field data, 2026). For the 0.6 kg FeSO4·7H2O dose in the worked example above, that is roughly 0.12–0.24 kg dry solids per m³. Dewatering on a recessed-chamber filter press to 25–35% DS cake, then landfill or hazardous disposal at $80–$200/t wet cake, lands at $0.04–$0.12/m³ — small in percentage terms, large in absolute dollars at plant scale. Cross-check this against the filter press OPEX benchmarks for iron sludge dewatering when sizing the dewatering train, because the dewatering capex and the Fenton reagent decision are coupled.
pH correction. Fenton requires pH 2.5–3.5 in the reactor, then re-neutralization to 6–9 for discharge or biological polishing. On a high-alkalinity stream, NaOH consumption can equal or exceed H2O2 cost per m³, which is why half the OPEX-reduction work in mature Fenton plants is upstream pH buffering rather than reaction chemistry. Titrating against the actual alkalinity, not a literature default, typically saves 20–35% on the base line.
Energy and labor. Mixing and aeration for the Fenton train draw 0.05–0.25 kWh/m³ at $0.08–$0.14/kWh industrial tariff. Labor for a 500–2,000 m³/d train runs 0.5–2.0 operator-hours per day at $25–$45/h fully loaded. Pump, instrument, and tank-integrity maintenance typically lands at 3–5% of CAPEX per year for a Fenton skid — a number that holds across municipal and industrial deployments and that finance teams will recognize from any process equipment class.
Classical Fenton vs Ozone vs UV/H2O2 vs Electro-Fenton: 2026 OPEX Comparison
The matrix below is what a steering committee will ask for in the first meeting. It benchmarks the four AOP options most commonly screened alongside Fenton for COD and color removal, in 2026 industrial USD.
| Technology | 2026 OPEX ($/m³) | 2026 OPEX ($/kg COD removed) | Dominant cost line | Best-fit matrix |
|---|---|---|---|---|
| Classical Fenton | $0.18–$0.85 | $0.30–$1.20 | H2O2 + FeSO4 (55–70%) | High COD, high color, non-refractory; landfill leachate, textile, pharma |
| Ozone-based AOP | $0.30–$1.10 | $0.40–$1.50 | O2 feed + corona power (60–75%) | Refractory micropollutants, low-TDS, tight TOC limits |
| UV/H2O2 | $0.40–$1.30 | $0.50–$1.60 | Lamp replacement every 8,000–14,000 h (40–55%) + H2O2 | Small footprint, no sludge, trace organics polishing |
| Electro-Fenton | $0.20–$0.80 | $0.20–$0.80 | Electrode wear + power (50–65%) | Sludge-disposal-constrained sites, <2,000 mg/L COD |
| Electrooxidation (anodic) | $0.05–$0.07 | $0.15–$0.35 | Electrode material + power | Low-flow polishing, high-value wastewater (Comparison with Ozonation and Fenton, peer-reviewed) |
The decision rule that holds across the literature and field data: classical Fenton wins on heavy COD plus high color in a non-refractory matrix because the reagent cost per kg COD removed is hard to beat at scale. Ozone and UV/H2O2 win when the discharge limit targets refractory micropollutants or TOC that Fenton cannot crack, because Fenton residual H2O2 also pushes downstream BOD up and complicates biological polishing. Electro-Fenton wins when sludge disposal cost is the binding constraint, with the 34% OPEX reduction reported in the Scientific Reports 2024 composite-wastewater study ($2.063 vs $3.117 per batch) being a representative — not universal — data point. For the underlying ozone system sizing, see the ozone AOP engineering guide.
Worked Example: 1,000 m³/d Landfill Leachate Fenton OPEX
Translating the model into a signable number: a 1,000 m³/d landfill-leachate plant, influent COD 5,000 mg/L, pH 7.8, target 90% COD removal to meet a 500 mg/L local discharge limit. The stoichiometric dose at 1.5 g H2O2/g COD and 0.4 g Fe²⁺/g COD is 7.5 kg of 50% H2O2 and 2.0 kg of FeSO4·7H2O per m³ — aggressive for a refractory matrix, but achievable when Fenton is staged before a biological polisher. With pH 7.8 influent and a high-alkalinity leachate, expect 0.6 kg H2SO4 (98%) per m³ for acidification and 1.2 kg NaOH (50%) per m³ for re-neutralization.
| Line item | Quantity (kg/m³) | Unit cost (2026 USD/kg) | Cost ($/m³) |
|---|---|---|---|
| Hydrogen peroxide 50% | 7.5 | $0.85 | $6.38 |
| Ferrous sulfate heptahydrate | 2.0 | $0.26 | $0.52 |
| Sulfuric acid 98% | 0.6 | $0.18 | $0.11 |
| Sodium hydroxide 50% | 1.2 | $0.50 | $0.60 |
| Iron sludge disposal | — | — | $0.08 |
| Energy (mixing + aeration) | — | — | $0.04 |
| Labor (allocated) | — | — | $0.06 |
| Total unoptimized | — | — | $7.79/m³ |
| Optimized (0.6 g H2O2/g COD, Fenton → biological polish) | 3.0 kg H2O2 | $0.85 | $0.42/m³ reagents |
| Optimized total OPEX | — | — | ≈ $0.60/m³ |
At optimized dosing, total OPEX lands at roughly $0.60/m³ — about $219,000/year at 1,000 m³/d and 365 operating days. The dewatering train is sized against this OPEX and the reagent-storage tank inventory: a iron-rich sludge dewatering filter press rated for 0.12–0.24 kg DS/m³, paired with a PLC-controlled Fenton reagent dosing skid for H2O2:Fe²⁺ ratio control, is the standard equipment pairing behind this number.
Seven Practical Levers to Cut Fenton Operating Cost in 2026
- Jar-test the H2O2:Fe²⁺ ratio on your actual stream. Over-dosing is the #1 cost leak — every 0.5 g H2O2/g COD saved is about $0.40/m³ at 2026 prices.
- Reuse Fe³⁺ sludge via acid regeneration or electrocoagulation. Cuts fresh FeSO4 demand 40–60% on continuous operations; payback typically under 18 months above 500 m³/d.
- Install online COD and ORP sensors. Stopping the reaction at the breakpoint (ORP plateau) prevents the 20–30% peroxide over-dose that batch testing alone misses — control logic is straightforward on a PLC-controlled Fenton reagent dosing skid.
- Stage Fenton with biological polishing. Running Fenton as a pre- or post-treatment to a moving-bed biofilm reactor (MBBR) or membrane bioreactor drops reagent loading 30–50% and is the single largest OPEX lever in municipal-style applications.
- Buy 35% or 50% H2O2 in bulk. Above 50 t/y consumption, bulk delivery typically delivers a 15–25% unit-cost reduction versus drums; tank-farm permitting is the only real obstacle.
- Recover neutralization exotherm for influent pre-warming. Cold-climate sites (sub-10 °C influent) recover 5–10% reaction rate and meaningfully smaller H2O2 doses by preheating 3–5 °C off the neutralization step.
- Benchmark against electro-Fenton when sludge disposal exceeds $80/t. Payback often lands under 24 months above 2,000 m³/d flow; the 34% OPEX reduction reported in the 2024 Scientific Reports composite-wastewater study is representative of mid-strength industrial matrices.
For sites considering Fenton as a polish step downstream of a high-recovery membrane train, the forward osmosis OPEX breakdown gives a defensible baseline for the upstream membrane system against which Fenton reagent costs should be netted.
Frequently Asked Questions
How much does hydrogen peroxide cost per cubic meter in a Fenton system? At a 1.5 g H2O2/g COD dose on 1,000 mg/L COD influent, expect 2.4 kg of 50% H2O2 per m³, which at $0.55–$1.20/kg industrial 2026 pricing is $1.32–$2.88/m³ — typically 40–55% of total Fenton OPEX (HydropureWater field data, 2026).
Is Fenton cheaper than ozone for COD removal? For non-refractory high-COD streams above 2,000 mg/L, classical Fenton typically beats ozone by 30–50% on $/kg COD removed, because ozone OPEX is dominated by O2 feed and corona power; for refractory micropollutants the order flips (peer-reviewed AOP comparison data, 2024–2025).
What is the iron sludge disposal cost for a Fenton system? Iron hydroxide sludge runs 1.5–3.0 kg DS per kg Fe²⁺ dosed; landfill disposal after filter-press dewatering to 30% DS cake typically costs $0.04–$0.12/m³, or 8–15% of Fenton OPEX at typical dosing (HydropureWater field data, 2026).
How much does electro-Fenton save over classical Fenton? Electro-Fenton cuts total operating cost 20–35% versus classical Fenton at matched COD removal, with the 2024 Scientific Reports composite-wastewater study reporting $2.063 vs $3.117 per batch — a 34% reduction driven mainly by lower reagent consumption and eliminated sludge handling.